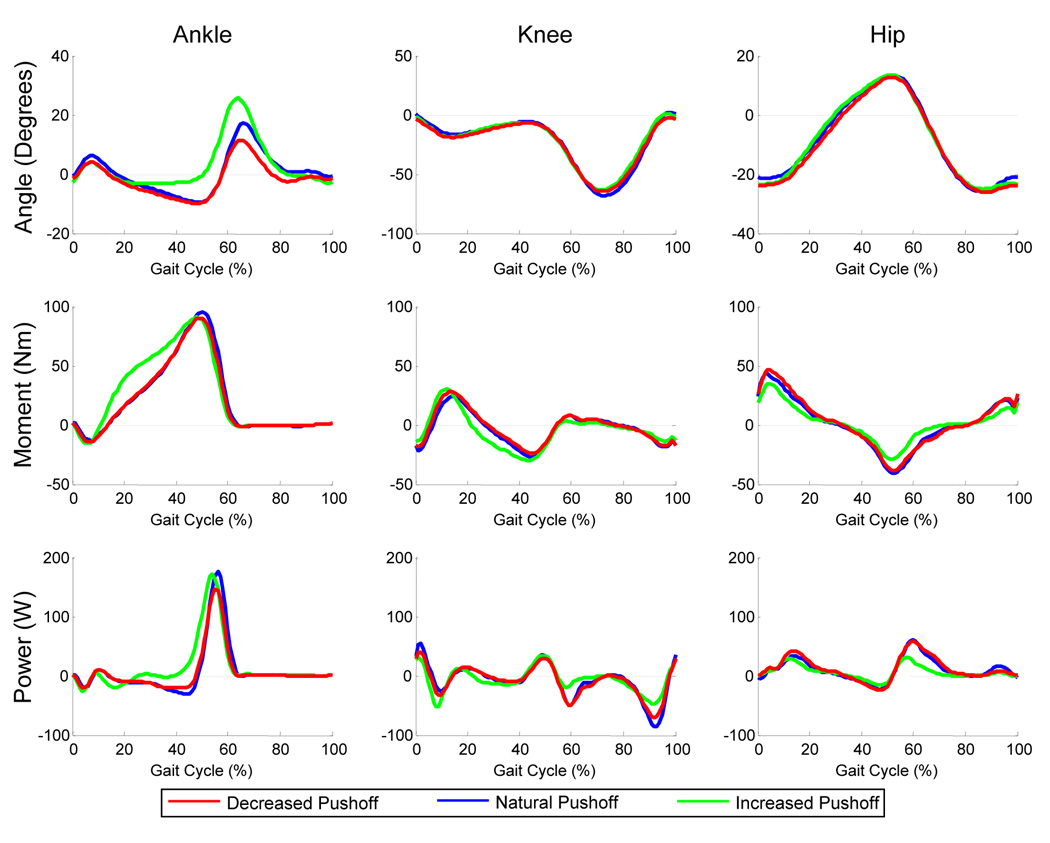
FIGURE 3. Ankle, knee and hip joint kinematic and kinetic data.
Data represents the mean for all subjects (N=10) walking in each of the three conditions. Data are normalized from left heel strike to left heel strike. Ankle plantar flexion, knee extension and hip extension are positive. Ankle plantar flexion angular impulse was higher in the Increased Pushoff condition compared to the Natural Pushoff condition. There were concurrent decreases in hip flexion peak moment, peak powers, and angular impulse, and hip extension peak moment and angular impulse compared to the Natural Pushoff condition (p<0.05).

