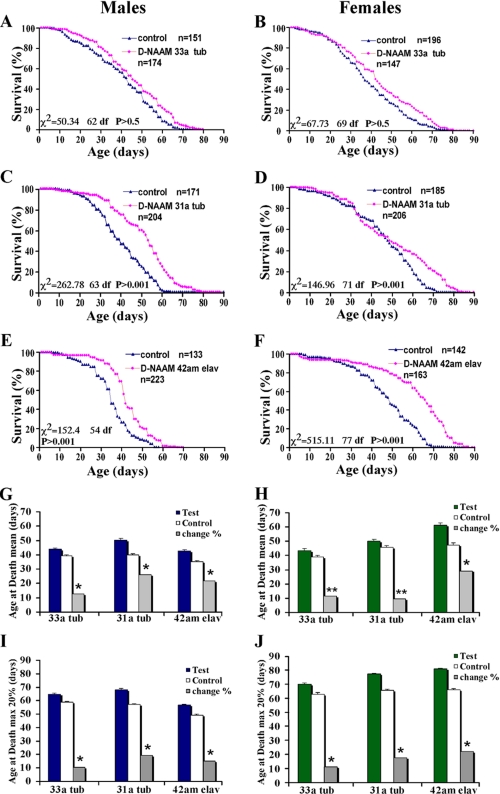
FIGURE 5.
D-NAAM overexpression extends Drosophila life span. A-F, survival curves for male (A, C, and E) and female (B, D, and F) adult flies expressing low (D-NAAM33; A and B) or middle (D-NAAM31; C and D) D-NAAM protein levels ubiquitously via the tubulin-Gal4 driver or of a high expressing line expressing D-NAAM strictly in neurons via the elav-Gal4 driver (D-NAAM42; E and F; see Fig. 4A for D-NAAM expression levels in the specific lines). A genetically matching control line was used for each test line. Indicated are the n values for each experiment and the statistical parameter values. See supplemental Table S2 for the complete longevity analysis. G-J, mean (G and H) and the maximal life span of the top 20% survivors of test and control flies (I and J). The gray bars represent the percentage of change between the matching control and the test line for each pair. The single asterisk denotes a p value <0.005, and two asterisks denote a p value <0.05.

