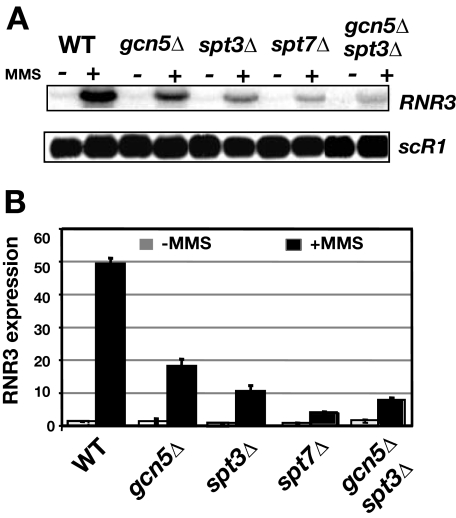
FIGURE 1.
Analysis of RNR3 expression in different classes of SAGA mutants. A, Northern blot of RNR3 levels in total RNA from untreated (–) or cells treated with MMS for 2.5 h (+). scR1, an RNA polymerase III-transcribed gene, was used as a loading control. B, quantification of RNR3 signals corrected for scR1 levels. The level of RNR3 in untreated wild type (WT) cells was set to 1.0. The values shown in gray and black bars were calculated from untreated and MMS-treated samples, respectively. Results are presented as the means and S.D. of three samples.

