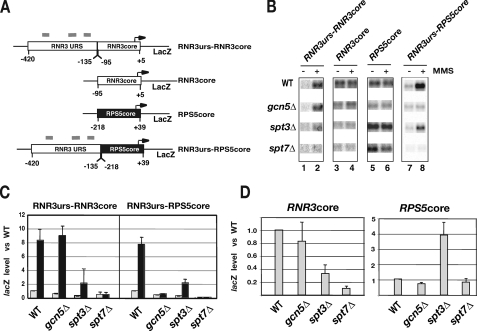
FIGURE 5.
Mapping the SAGA-dependent region of RNR3. A, lacZ-containing reporter vectors were constructed by fusing the upstream and core promoter regions of RNR3 and RPS5 together as indicated in the panel. The sequences within each of the genes are indicated below and are relative to the start site of transcription, which was set to +1. Gray bars indicate the approximate locations of the damage response elements. B, transcription was measured by Northern blotting for lacZ message as described in Li and Reese (24), and a representative Northern blot is shown. WT, wild type. C, quantification of lacZ signals corrected for scR1 levels. The level of lacZ in untreated wild type cells was set to 1.0. Results are presented as the means and S.D. of three experiments. The values shown in gray and black bars were calculated from untreated and MMS-treated samples, respectively. D, as in C, except that the data from untreated samples are shown.

