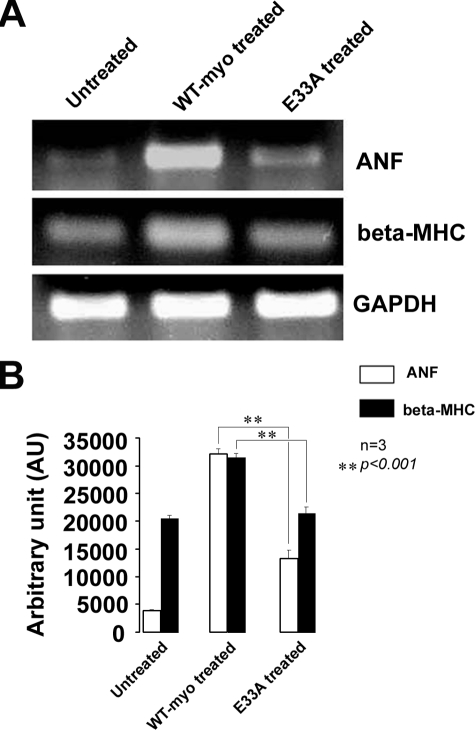
FIGURE 11.
Expression of hypertrophic marker genes (ANF and β-MHC) in untreated control, wild type, and E33A myotrophin-treated neonatal rat ventricular myocytes. Reverse transcription-PCR banding profile (A) showed down-regulation of ANF and β-MHC in untreated control and E33A-treated cells compared with wild type (WT) myotrophin-treated cells (glyceraldehyde-3-phosphate dehydrogenase as internal control). Band intensity was quantified using ImageJ software and expressed in arbitrary units (B).

