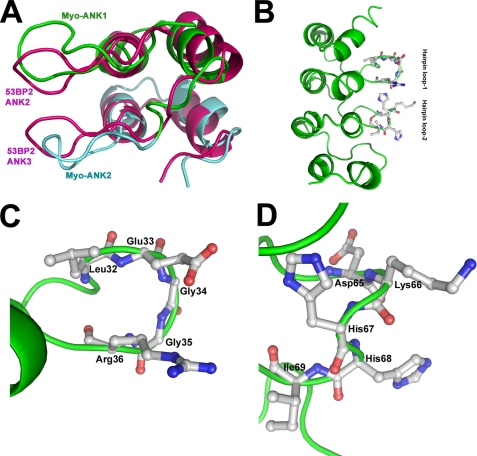
FIGURE 4.
A, comparison of the ANK1 and ANK2 regions of myotrophin with those of ANK2 and ANK3 of 53BP2 (adopted from Ref. 2). B, ribbon representation of overall structure of myotrophin showing two hairpin loops protruding from the core structure. C and D, magnified views of hairpin loop 1 (C) and hairpin loop 2 (D) of myotrophin showing the amino acid side chains in each loop. Molecular graphics were rendered using Pymol 0.9 (www.pymol.sourceforge.net).

