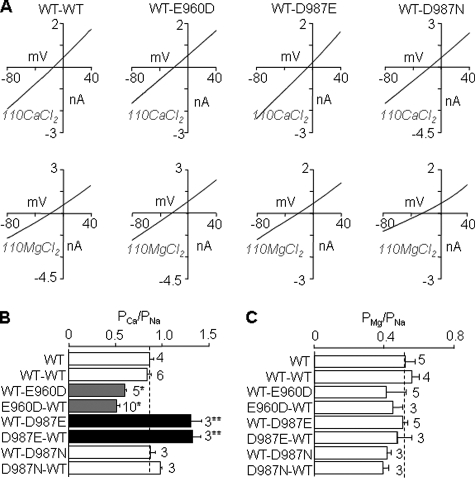
FIGURE 5.
Ca2+ and Mg2+ permeability of functional subunit concatemers. A, representative I/V curves from cells expressing the indicated concatemers in extracellular 110 mm CaCl2 (top) or 110 mm MgCl2 solution (bottom). B and C, summary of the PCa/PNa (B) and PMg/PNa (C), derived from reversal potentials measured from the I-V curves shown in A, for all the subunit concatemers examined. The dotted lines show the mean values for the WT channel. The number of cells examined in each case is indicated. *, p < 0.05, and **, p < 0.01, when compared with WT-WT concatemer and WT.

