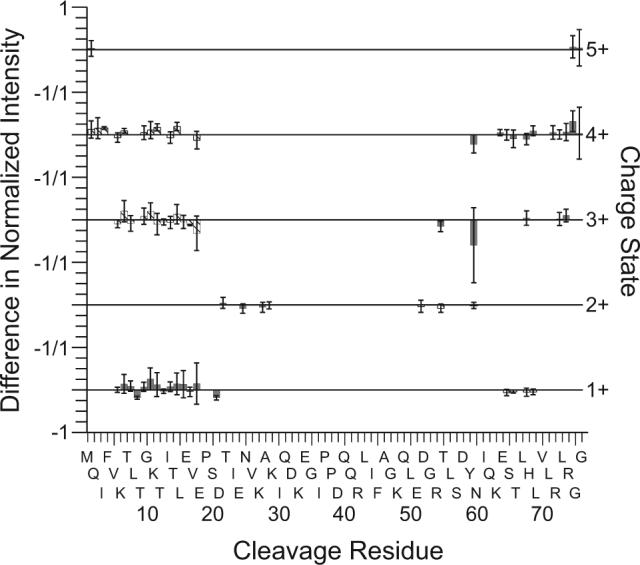
Figure 3.

Differences in ECD fragment ion intensities, separated by charge state, for ubiquitin 6+ transmitted through the FAIMS device at CV values of −6.6 and −7.3 V. Fragment ion intensities are normalized to the total fragment ion intensity and are averaged from results of three replicate measurements for each compensation voltage. The difference in intensity of each fragment is calculated by subtracting the average fragment ion intensity with a CV value of −6.6 from the average fragment ion intensity with a CV value of −7.3. The bar height indicates the magnitude of the difference in the normalized fragment intensity for c (shaded bars) and z (cross hatched bars) ions. Greater ion intensities from a CV value of −6.6 V are plotted as positive values. Error bars represent ± one standard deviation from the mean value for three replicate measurements. Fragment ion charge state is indicated on the right y-axis. The −1/1 labels in the left y-axis indicates −1 difference in normalized fragment intensity for the upper charge state and a difference of 1 for the lower charge state.
