
Figure 4.
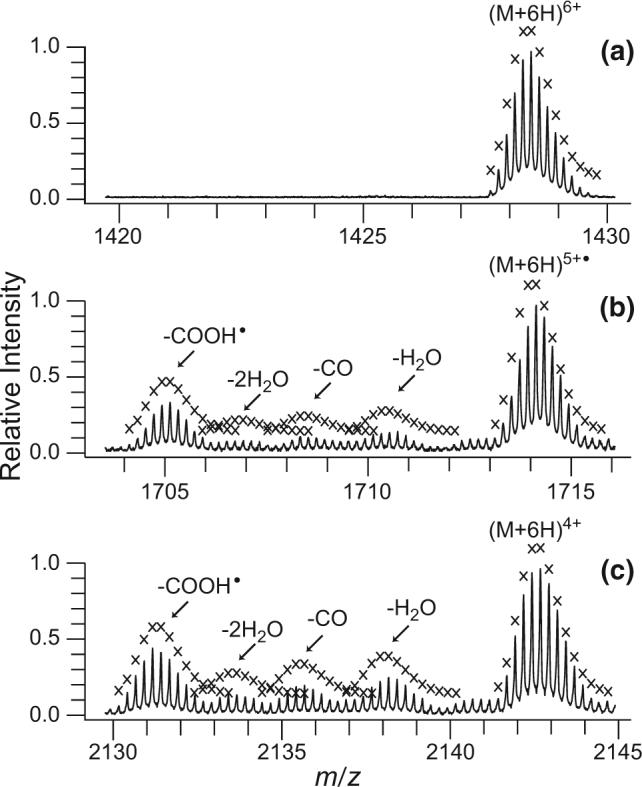
Partial ECD mass spectrum of ubiquitin 6+ produced by ESI of 10−5 M bovine ubiquitin in 49.9/49.9/0.2, by volume water/methanol/acetic acid, and transmitted through the FAIMS device with a CV value of −6.6 V showing (a) residual precursor ion, (b) reduced molecular ion that captured one electron, and (c) reduced molecular ion that captured two electrons. Theoretical isotope distributions for the precursor, reduced precursors with no hydrogen atom loss, and for the fragment ions corresponding to small neutral losses are indicated by “x.” Calculated isotope distributions corresponding to ions that have lost either NH3 or OH· were not included in this figure for clarity.