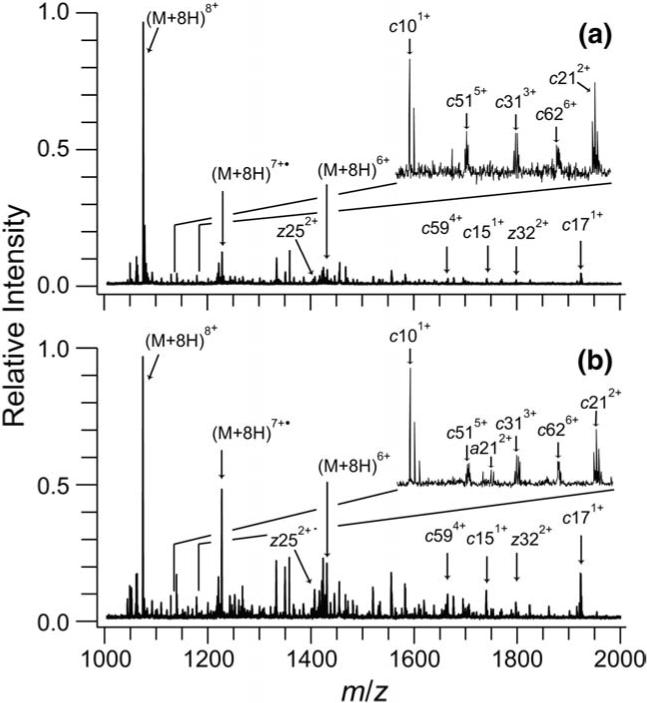
Figure 6.

ECD mass spectra of ubiquitin 8+ produced by ESI of 10−5 M bovine ubiquitin with 49.5/49.5/1, by volume water/methanol/acetic acid, and transmitted through the FAIMS device at CV values of (a) −4.7 and (b) −6.3 V. Residual precursor ion, reduced molecular ions, and prominent c and z fragment ions peaks are indicated. The inset shows the region from 1135−1175 m/z with fragment ions present in this region labeled. Many additional fragment ions are also present in the spectra but, for clarity, are not labeled.
