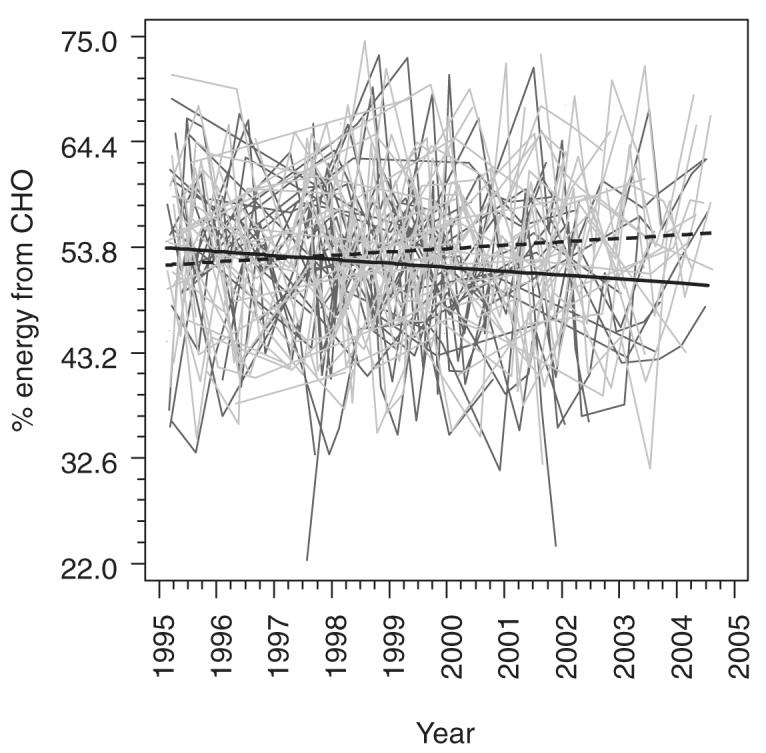
FIGURE 2.

Individual trajectories for the percentage of energy from carbohydrate in male (dark gray) and female (light gray) subjects as well as fitted means for males (solid black line) and females (dashed black line) with 50% weight on each center from a generalized linear model including center, sex, years since the beginning of the study (14 February 1995), and the interaction between years and sex. Estimates were obtained by using generalized estimating equations with an exchangeable working correlation structure to account for potential correlations between repeated measurements in the same individuals.
