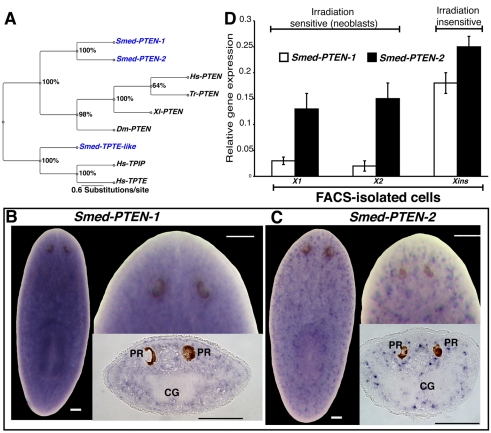
Fig. 1. Smed-PTEN phylogenetics and expression studies.
(A) Bayesian analysis of PTEN family members shown as an unrooted tree with relative branch lengths. Bootstrap support is shown for each node. Species used: Smed (Schmidtea mediterranea), Hs (Homo sapiens), Tr (Takifugu rubripes), Xl (Xenopus laevis), Dm (Drosophila melanogaster). (B, C) Representative whole-mount ISH in intact worms showing the widely distributed expression patterns (purple precipitation) for both Smed-PTEN-1 and Smed-PTEN-2, respectively. In both cases anterior is at the top; bars, 100 μm. A more detailed view of the expression patterns, including area in front of the photoreceptors, can be visualized at higher magnifications for both genes, as well as from tissue sections. PR: photoreceptors; CG: cephalic ganglia. (D) Smed-PTEN-1 and Smed-PTEN-2 qRT-PCR from different cell populations isolated by flow cytometry. Note that both genes are expressed in irradiation sensitive (X1 and X2) and insensitive (Xins) cells, consistent with the wide distribution observed in whole-mount ISH results. Expression levels are relative to the standard internal control clone (H.55.12e). Numbers are expressed as the average of triplicate experiments (± s.d.) from two different preparations.

