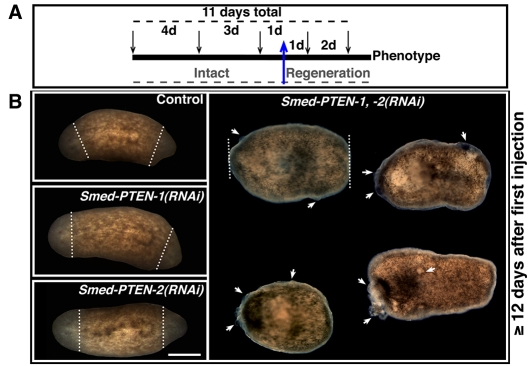
Fig. 3. Microinjection schedule and its effects during tissue regeneration.
(A) Microinjection schedule. A total of five injections (arrows) were performed during 11 days (top dashed line). Injections were administered at different intervals (numbers between arrows). The blue arrow depicts the stage at which bipolar amputation was performed and the dashed line (gray) at the bottom highlights the experimentation period during which animals were either intact or under regeneration. (B) Representative images of experimental groups between three and eight days post-amputation (the amputation level is represented by the white dashed line). Conditions shown: control (water-injected), Smed-PTEN-1(RNAi), Smed-PTEN-2(RNAi), and simultaneous Smed-PTEN-1, -2(RNAi). No external differences were observed during anterior or posterior blastema formation (unpigmented tissue formed after amputation) between the first three conditions (left column), whereas in simultaneous RNAi fragments, important behavioral and macroscopic abnormalities were noted (n=47/47 worms, similar numbers for each group were run in parallel). Abnormal outgrowths (white arrows) were evidenced in different parts of the animal (including the tissue surrounding the amputation area) followed by lysis shortly after visualization of the first sign of the phenotype. In all cases anterior is to the left. Bar, 500 μm.

