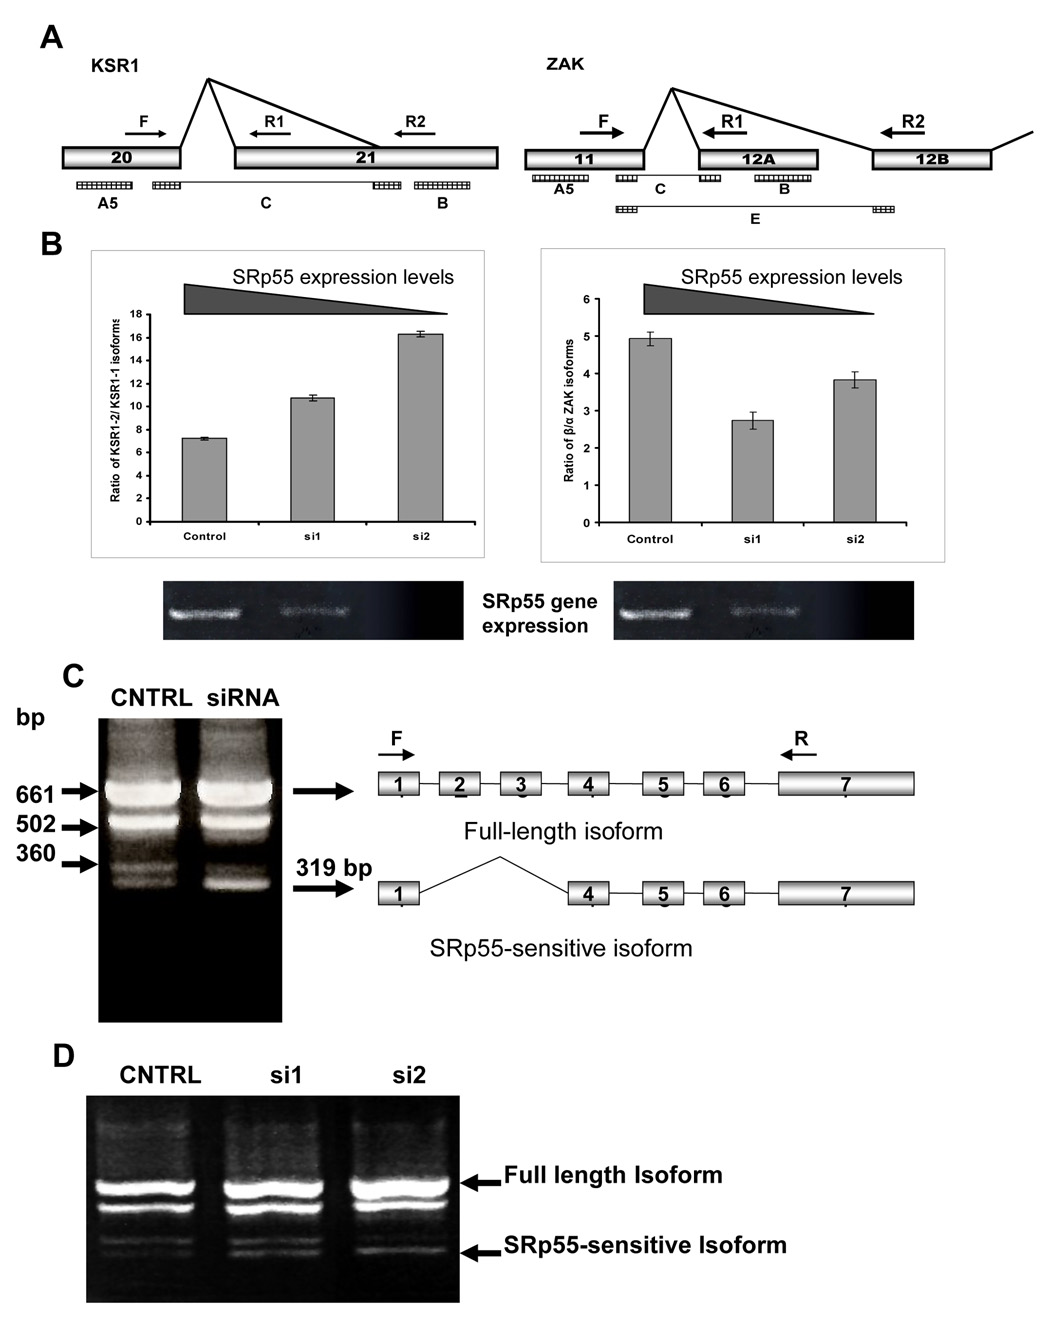
Figure 2. Splicing patterns of KSR1, ZAK and mda7/IL24 genes are sensitive to SRp55 expression.
A. Schemes of the regions of the KSR1 and ZAK gene structures involved in the tested AS events. Arrows F, R1 and R2 show the primers used for RT-PCR analyses for each of these genes. Rectangles A5, B, C, and E show localization of the SpliceArray™ probes. B. Left panel: Increased expression of the KSR1 isoform with truncated exon 21 (KSR1-2) in SRp55-depleted U2OS cells. The graph shows quantification of the ratio between KSR1 isoforms, as recognized by primers F+R1 (KSR1-1) and F+R2 (KSR1-2) in U2OS cells with different levels of SRp55 expression. Right panel: Changes in the splicing of the ZAK gene in SRp55-depleted U2OS cells. The graph shows quantification of the ratio between the two ZAK isoforms, as recognized by primers F+R1 (β isoform) and F+R2 (α isoform) in U2OS cells with different levels of SRp55 expression. Two lower panels show RT-PCR analysis of SFRS6 expression in these RNA samples isolated from U2OS cells treated with scrambled siRNA (Control), 0.25 µg or 0.5 µg SRFS6 specific siRNA (si1 and si2, respectively). C. Silencing of SRp55 expression by specific siRNA up-regulates the abundance of the isoform represented by a 319 bp band in RT-PCR analysis using the primers designated by arrows F and R. D. The amount of the SRp55-sensitive isoform is proportional to the levels of silencing of SRp55. U2OS cells were treated with scrambled siRNA (CNTRL), 0.25 µg or 0.5 µg SRFS6 specific siRNA (si1 and si2, respectively) to decrease SRp55 expression gradually. Isolated RNA was subjected to RT-PCR analysis.

