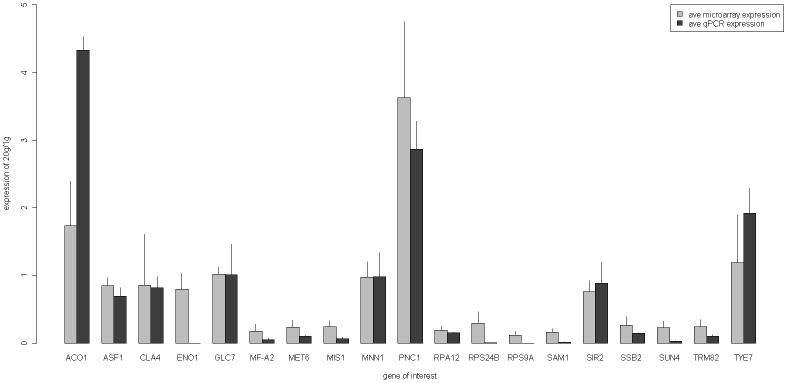
Figure 3.
Correlation between average expression ratios from quantitative real-time reverse-transcription polymerase chain reaction (qPCR) and microarrays. Genes were selected from categories important in yeast aging. Average ratios of old to young messenger RNA (mRNA) for each gene, plus or minus standard deviations, are shown. Microarray data are from Bioconductor (22-24) using LOWESS smoothing; qPCR data are from standard curve method (ABI) with standard deviations calculated according to the ABI Guide, “Performing Relative Quantitation of Gene Expression Using Real-Time Quantitative PCR,” available from the ABI Web site. The RNA preparations used for qPCR were from 18-20g cells for GLC7, MF(alpha)2 given as MF-A2, MET6, MIS1, PNC1, RPA12, SSB2, SUN4, and TRM82. The RNA preparations assayed for ACO1, ASF1, SIR2, and TYE7 were from 12g cells. The preparations assayed for CLA4 and MNN1 were from 8g cells.

