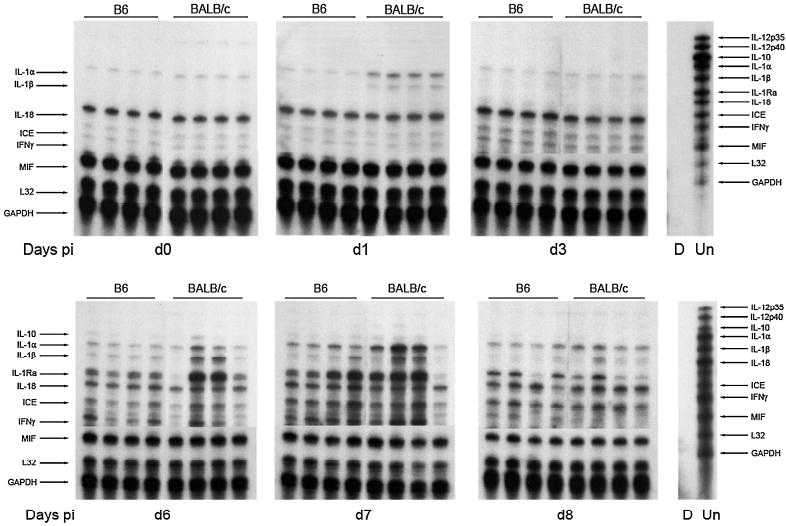
FIG. 3.

Inflammatory cytokine expression. Representative radiographs demonstrate the expression of inflammatory mRNAs in the CNS during VSV encephalitis. Each lane represents an individual mouse, killed on the indicated day post-infection. Lane D, digested probe control; lane Un, undigested probe set, with the chemokine represented by each undigested band listed on the right. Arrows on the left mark the indicated cytokine in each lane of the radiograph (digested size). These data are representative of three individual experiments.
