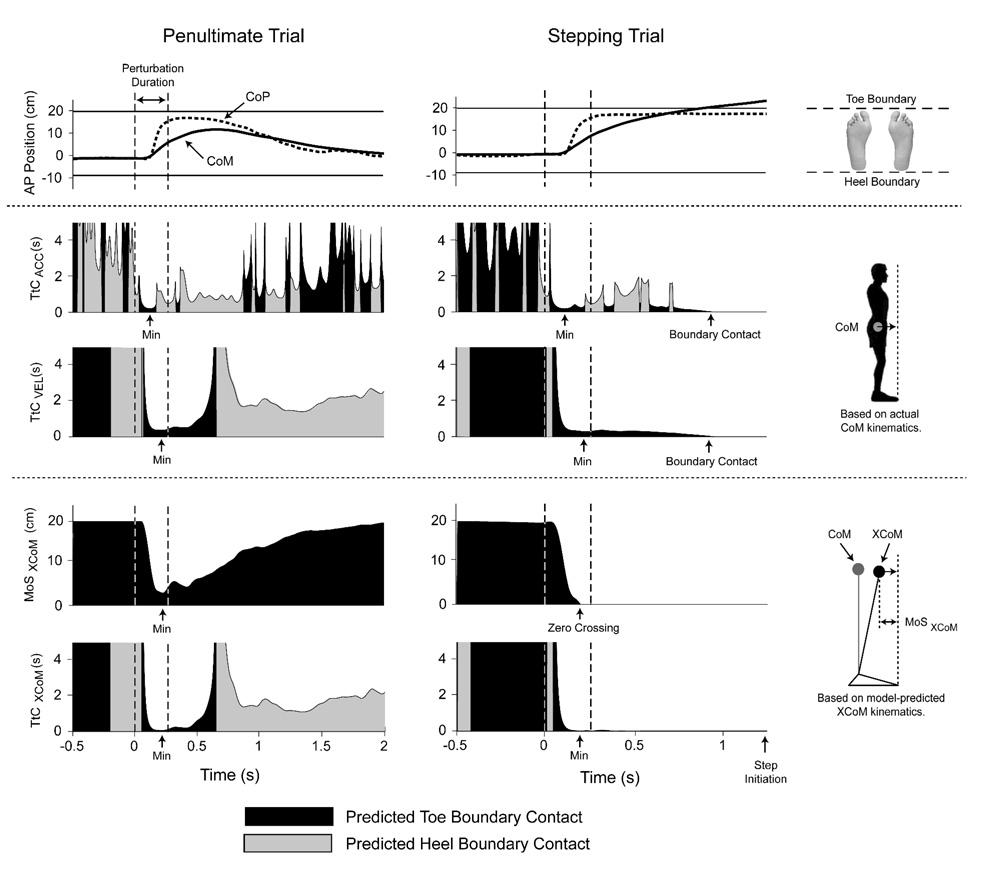
Figure 3.
Example of perturbation response for penultimate and stepping trials. Top graphs show center of mass (CoM) and center of pressure (CoP) kinematics, and toe and heel positions. Middle graphs show CoM time-to-contact (TtC) computed by including (TtCACC) and not including (TtCVEL) acceleration information. Bottom graphs show the margin of stability (MoSXCoM) and TtC (TtCXCoM) of the extrapolated center of mass (XCoM) based on an inverted pendulum model (Hof et al. 2005).

