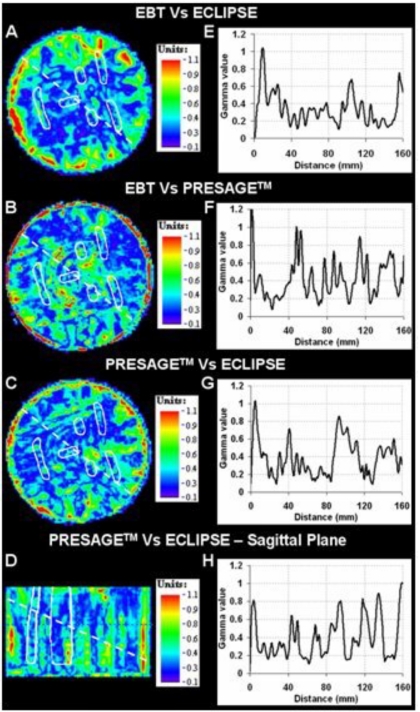
Figure 9.
Gamma maps on the central axial slice (criteria of 3% dose difference and 3 mm distance to agreement) between ECLIPSE® and EBT (a), PRESAGE™ and EBT (b), and ECLIPSE® and PRESAGE™ (c). (d) shows the gamma map between PRESAGE™ and ECLIPSE® on a sagittal view. PTV structures (white) are also overlaid. Plots (e)–(h) are the corresponding line profiles along the dashed lines.

