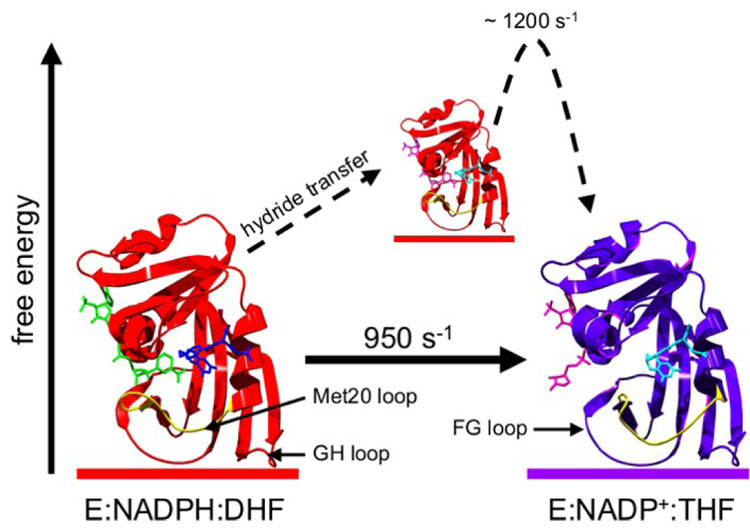
Figure 1.
Conformational dynamics in E.coli dihydrofolate reductase govern catalytic turnover. Prior to hydride transfer, the Met20 loop is in a ‘closed’ conformation (left, PDB 1RX2), but adopts an ‘occluded’ conformation following hydride transfer (right, PDB 1RX4). The rate constant for the ‘closed-to-occluded’ transition in E:THF:NADP+ determined by R2 relaxation dispersion (21) is strikingly similar to the maximum pH-independent hydride transfer rate constant (8). NADPH, DHF, NADP+ and THF are colored green, blue, pink and cyan, respectively. The Met20 loop is highlighted in yellow.

