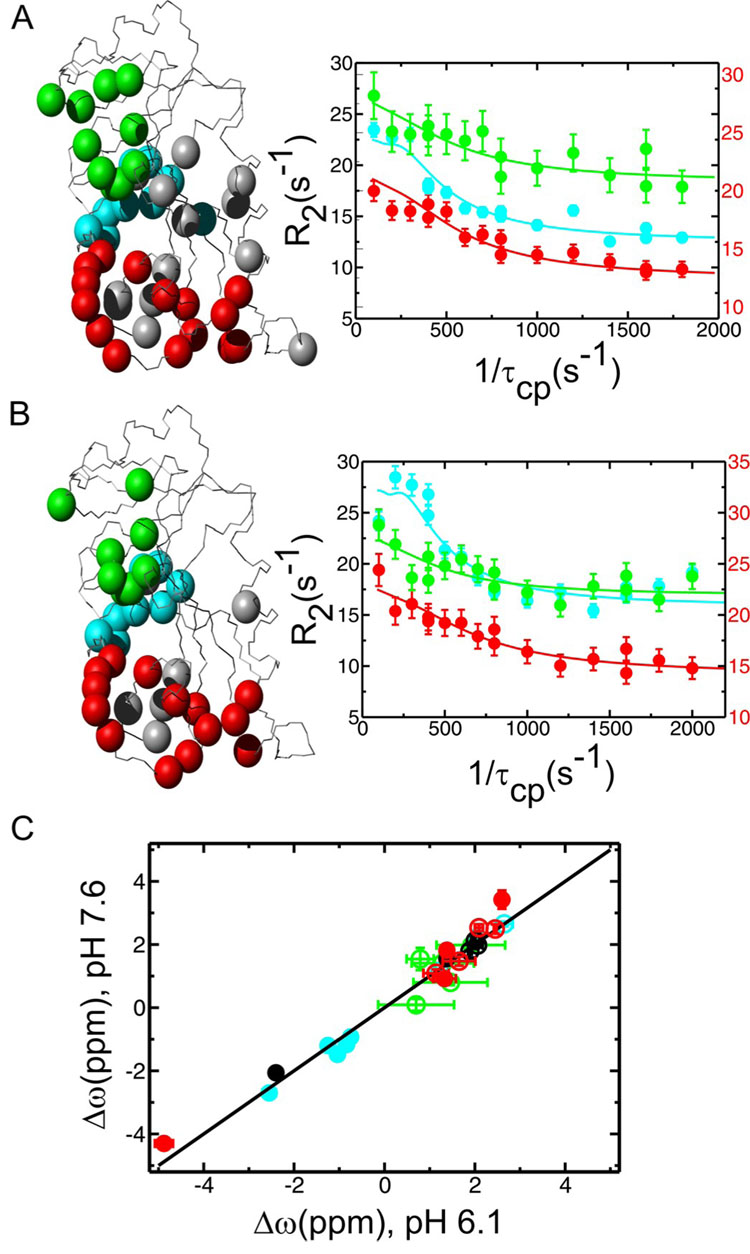
Figure 2.
Conformational exchange as measured by R2 relaxation dispersion in the product ternary E:THF:NADP+ complex of DHFR at pHs 7.6 (A) and 6.1 (B). (A and B) Residues displaying conformational exchange (Rex) are highlighted as colored spheres on the E:THF:NADP+ structure (PDB 1RX4) according to the cluster to which they belong (red and grey – active-site loops and associated residues, green – cofactor binding cleft, blue – C-terminal associated region). Representative R2 relaxation dispersion curves from each dynamic cluster are shown on the right (red – Gly121, green – Thr46 and blue – Asp131). Data were collected at two external magnetic fields (1H 500 and 800 MHz), but only 800 MHz field data are shown here for clarity. R2 rate constants for the red Gly121 curves are plotted on the right-hand y-axis to improve clarity. (C) Higher energy substates observed at pH 6.1 and 7.6 are similar as indicated by the 1:1 linear correlation between the dynamic chemical shift differences (Δω) observed in the R2 relaxation dispersion experiments at the two pH conditions. Data points are color coded as above. Filled circles indicate that the sign of Δω could be determined for both pHs using an HMQC/HSQC comparison according to (51). Unfilled circles indicate that the sign could not be determined for one or both pH conditions.

