
Figure 4. Detection of colon cancer stem cells markers after in vitro expansion.
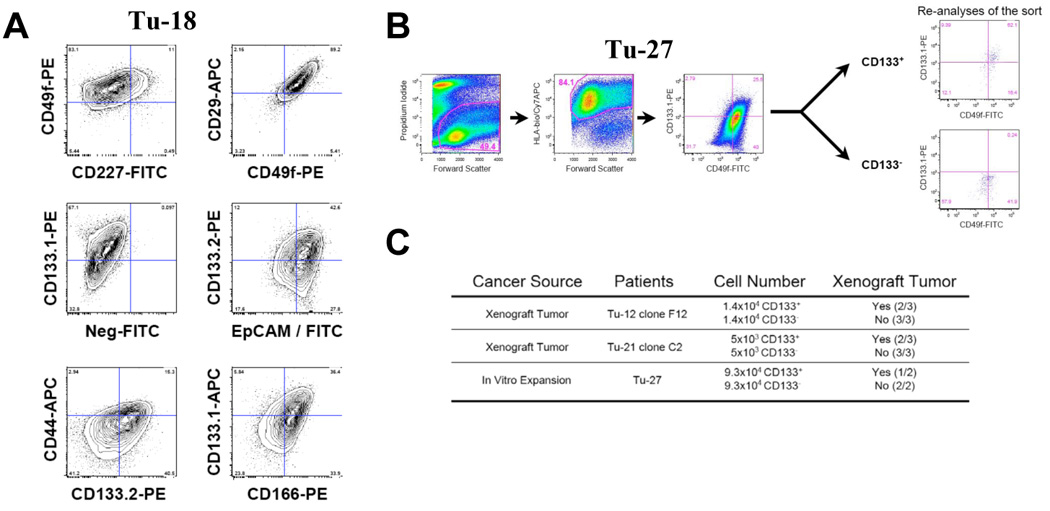
A, Flow cytometric contour plots (5% probability) demonstrating the expression of cancer stem cell markers on one representative culture of tumor tissues from metastatatic colon cancer (Tu-18). The dot plots depict two-color staining of live tumor cells from Tu-18 patient on a logarithmic scale. Quadrant markers were positioned to include in the lower left quadrant greater than 98% of control unstained live human tumor cells (not shown). The numbers are the percentage of live cells present in each quadrant after staining. B, Flow cytometric dot plots indicating the gating strategy and result of the CD133 positive and negative cell isolation. The dot plots depict two-color staining of live tumor cells from Tu-27 on a logarithmic scale. First plot, propidium iodide/forward scatter indicates the gate for live cells (49.4%), second plot indicates the gate for human tumor cells (84.1%, HLA+) and the third plot is the staining for CD133 (and CD49f). Quadrant markers were positioned to include in the lower left quadrant greater than 98% of control unstained live human tumor cells (not shown). The numbers are the percentage of live cells present in each quadrant after staining. The re-analyses of the isolated CD133+ and CD133− subpopulations are presented. C, Table of tumorigenic activity of CD133+ and CD133− human colon cancer cells. For Tu-12 and Tu-21, clones derived from a single cell were expanded in vitro and transplanted in mice to generate xenograft tumors described in the result section. Tumor cells isolated from the xenograft or from the culture (Tu-27) were sorted for CD133+ and CD133− cell populations as described. Cell populations with identical numbers of CD133+ and CD133− cells were transplanted to the left (CD133−) and right (CD133+) flanks of immunodeficient mice. Tumors were collected six to twelve weeks after transplantation.