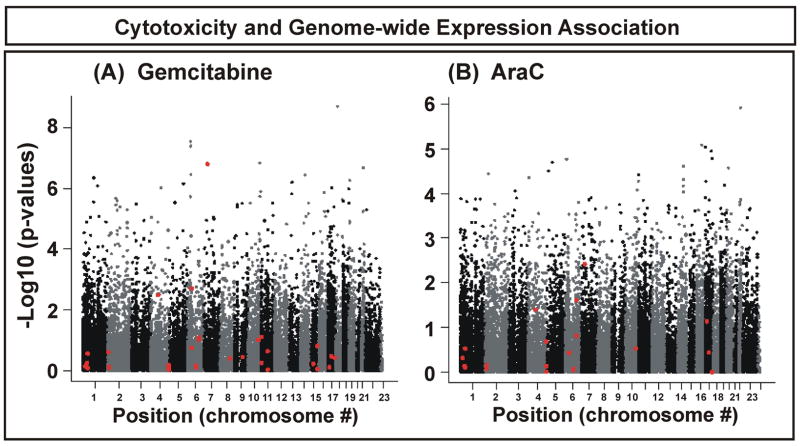
Figure 1.
Association between expression array data and IC50 values for gemcitabine and AraC. Each dot on the y-axis represents the –log10 (p-value) for the probe set with the lowest p-value for each gene. Probe sets are plotted on the x-axis with regard to the chromosomal location of their genes. Red dots represent probe sets for genes listed in Supplementary Table 1 that encode proteins within the cytidine analogue metabolism and target pathway.

