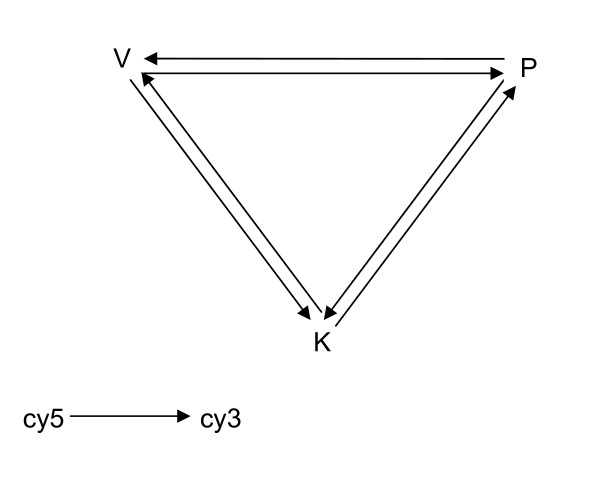
Figure 1.
Loop design of microarray experiment. V, P, K represent Vata, Pitta, Kapha and arrow head and tail indicate Cy3 and Cy5 respectively. In one set of experiment comprising of three slides each Prakriti has been labelled with Cy3 or Cy5 and hybridised to the other two Prakriti samples labelled with the opposite dye.

