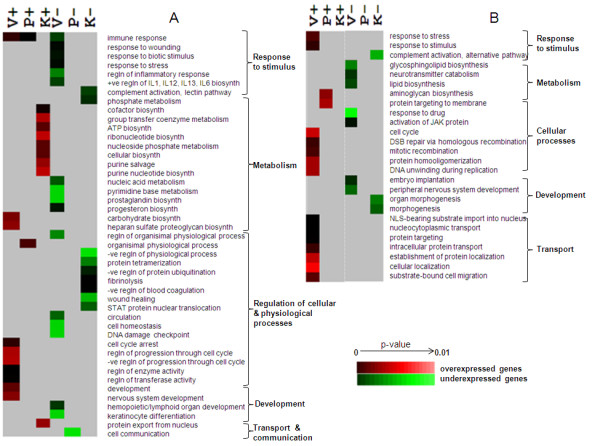
Figure 3.

Differentiating genome wide expression profile between Prakriti groups. Data shown is based on Gene Ontology Biological Process (GOBP) category enrichments in distinct Prakriti groups – "Vata" (V), "Pitta" (P) and "Kapha" (K). Each column defines profiles based on their unique expression in one Prakriti compared to the other two. For instance "P-" refers to down-regulation in Pitta when compared to Vata and Kapha and vice versa for "P+". Heat map (made using Cluster and Tree View) represented in Figures (A) and (B) depicts significant GOBP enrichments in male and female respectively.
