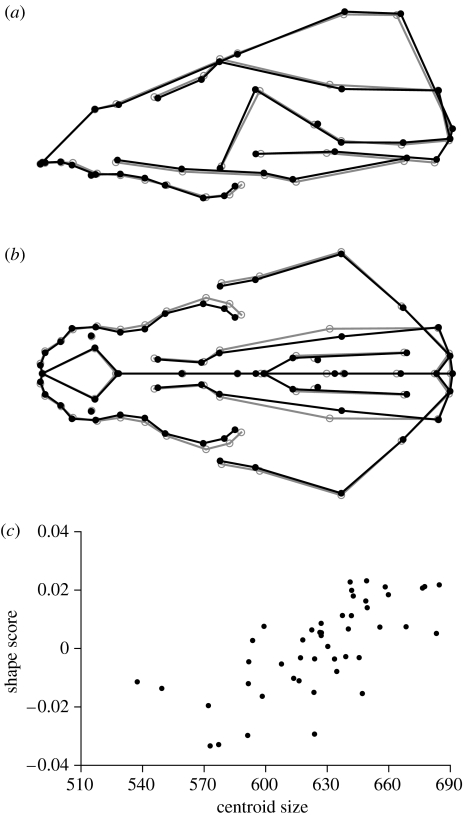
Figure 4.
Static allometry of adult St Bernard dogs. (a,b) Shape change associated with static allometry, estimated from regression of shape on centroid size in the historical data set. The grey circles show the average shape and the change from the grey circles to the black dots indicates the predicted landmark shift corresponding to an increase of centroid size by 100 mm. The grey and black lines are to indicate the contours of selected anatomical units in the same two shapes. (c) The corresponding shape scores for the dogs included in the study as a function of centroid size.

