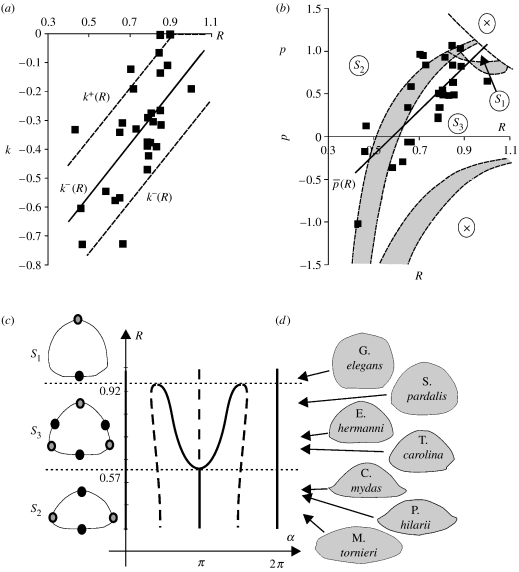
Figure 4.
Measured turtles and equilibrium classes. (a,b) Squares show the fitted model parameters corresponding to individual turtles in the [R, k] and [R, p] parameter planes. Linear regression (continuous lines) reveals and . (a) Dashed lines mark the approximate upper and lower envelope of the data points. (b) The equilibrium class of the model was determined for each point of the parameter space [R, p] under the assumptions of k=k+(R) and k=k−(R); boundaries of classes S1, S2 and S3 are shown by dashed lines in both cases. The grey shading between the two sets of boundaries shows regions of the [R, p] space where the equilibrium class of an individual may depend on k. Domain ‘X’ corresponds to parameter values not compatible with the model. (c) Angular positions α of equilibria on the main cross-section of the turtle shell as function of R under assumptions of and . Equilibria in all classes marked on main transversal cross-section by black (stable) and grey (saddle point) circles. Unstable equilibria off the main cross-section (near head and tail) are not indicated. (d) Fitted R value and contour of some measured individuals.

