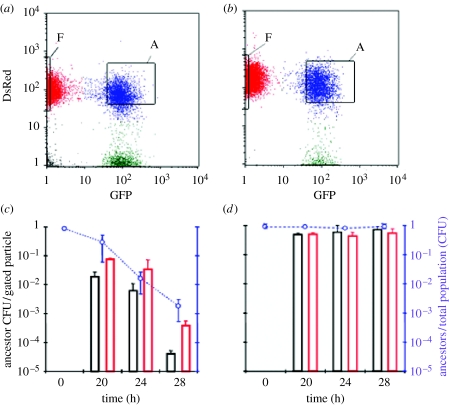
Figure 3.
FACS and colony formation analyses of mixed cultures of evolved and ancestral ABM cells. (a) Ancestral cells constitutively expressing DsRed were mixed with evolved cells constitutively expressing GFP at a 10 : 1 ancestor-to-evolved ratio and were analysed during 28 hours of mixed growth using flow cytometry. The relative GFP and DsRed fluorescence is shown on the x- and y-axes. The ‘F’ and ‘A’ windows enclose the free ancestors and aggregated cell populations, respectively, that were gated during the subsequent FACS sorting (see below). The ‘A’ population contained at least one evolved cell and one or more ancestor cells per particle. (b) As in (a), except that ancestor cells constitutively expressing GFP were used in place of evolved cells. (c) ‘A’ and ‘F’ cell populations were isolated from mixed cultures of GFP-labelled evolved and DsRed-labelled ancestor cells at the indicated times of incubation using FACS sorting. The plating efficiency was scored as the number of CFUs per sorted particle for a given population. Free ancestor cells are shown as red bars and evolved-bound ancestor cells are shown as black bars. The right axis shows the frequency of ancestral cells in the mixed cultures during the sampling period. (d) As in (c), except that GFP-labelled ancestral cells were used in place of GFP-labelled evolved cells. Data are means±s.d., n≥2 (time 28 hours, n=3).

