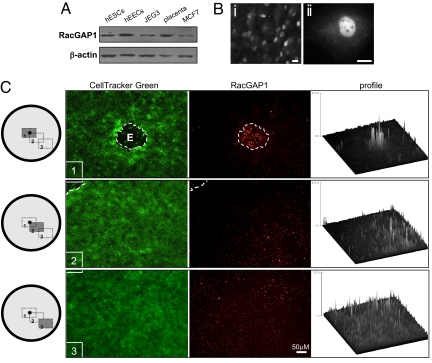
Fig. 6.
Regulation of RacGAP1 expression in hESCs in response to a human embryo. (A) Western blots demonstrate RacGAP1 expression in hESCs, human endometrial epithelial cells (hEECs), JEG3 choriocarcinoma cells, placenta, and MCF7 breast cancer cells. A loading control (β-actin) is also shown. (B) Immunohistochemistry of RacGAP1 showing localization in hESCs. Low (i) and high (ii) magnification images are shown. (Scale bars, 10 μm.) (C) RacGAP1 expression in CellTracker Green-labeled hESCs cocultured with human embryos is lowest in the region surrounding the embryo. Images were obtained from three different regions (1, 2, and 3) across the coculture monolayer as indicated in the schematic. Intensity profiling of the images shown demonstrates a gradient of RacGAP1 expression.

