Fig. 2.
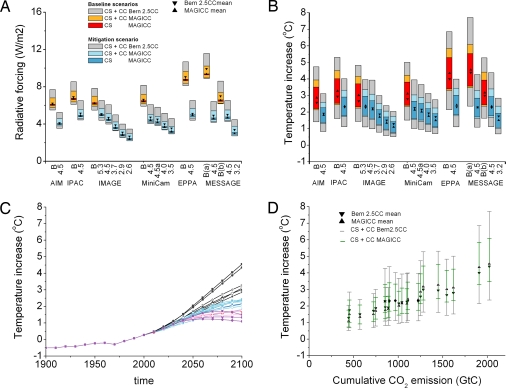
Radiative forcing and temperature change in year 2100 (A and B), transient temperature change (C) and 2100 temperature increase as a function of cumulative emissions (D). Radiative forcing relative to a preindustrial state and temperature change relative to 1980–2000 are given for baseline (red) and mitigation (blue) scenarios (A and B). Central values are shown as symbols and uncertainty ranges as color bands. Uncertainty ranges in MAGICC originate from the 19 MAGICC runs emulating different AOGCMS (mean ± 1 σ across 19 MAGICC runs) with darker area showing the impact of climate sensitivity only (CS; CS range is 2.0–4.9°C), and the lighter shaded uncertainty ranges show the combined effect of climate sensitivity (CS) plus carbon cycle response (CC) uncertainties (i.e., CS + CC). The full Bern2.5CC model ranges (CS + CC) were obtained by combining different assumptions about the behavior of the CO2 fertilization effect, the response of heterotrophic respiration to temperature, and the turnover time of the ocean, thus approaching an upper boundary of uncertainties in the carbon cycle (CC), and additionally accounting for the effect of varying climate sensitivity (CS) from 1.5 to 4.5°C. C includes the increase of global mean temperature over time for MAGICC (using the same color codes and symbols as Fig. 1). D shows the temperature increase (mean and CS + CC range) for both climate models as a function of cumulative CO2 emissions from 2000 to 2100.

