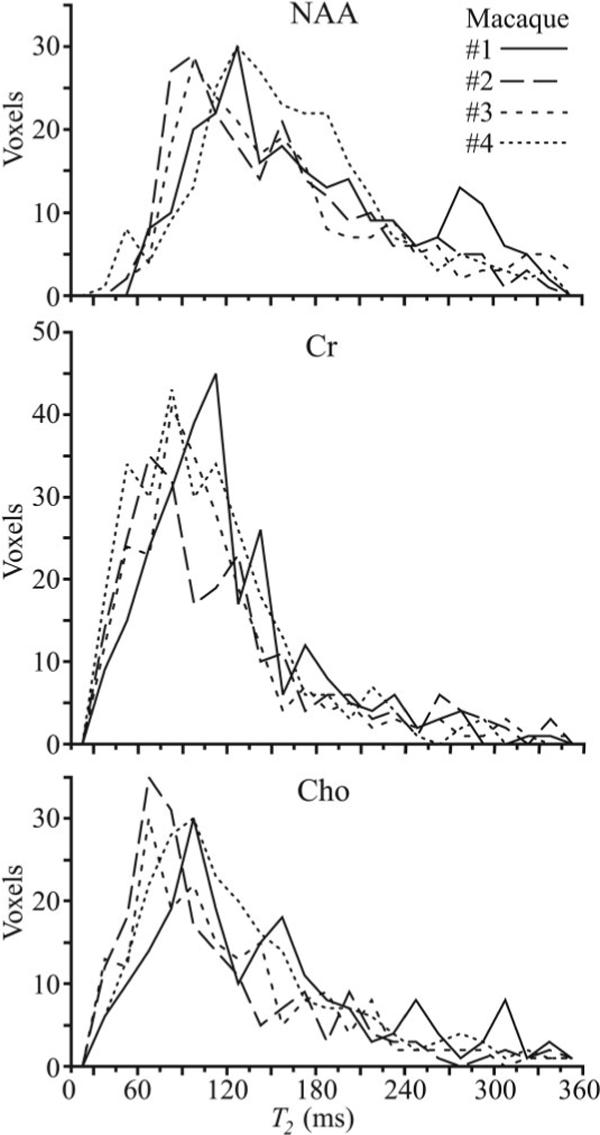
FIG. 3.

Histograms of the NAA, Cr, and Cho T2s from all 320 voxels in the VOI for each of the four macaques. Note the interprimate similarity of the histograms for each of the metabolites, indicating that: 1) a global T2 value for each would lead to less than ±10% variation in metabolic quantification; and 2) these T2 distributions are, therefore, probably characteristic of “healthy” in this species’ brain. Note that the histograms peak positions yield T2 values similar to those reported in the human brain at 7T, making the macaque a good model system in this respect.
