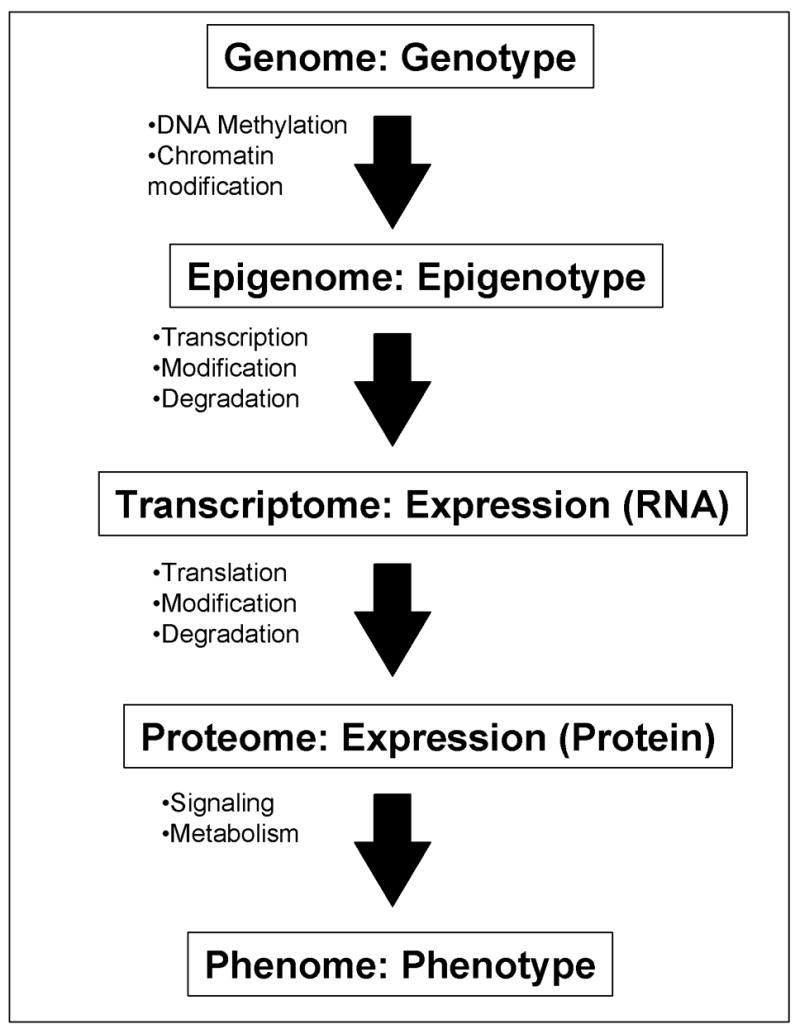
Figure 1. Genome-wide profiling of a cell at different levels.

A flow of information from genome/genotype to phenome/phenotype is shown: each step represents one-to-many relationship. All the cells in individual mouse contains the same whole set of DNAs – “genome” (with some exceptions), but individual cells can have different “epigenomes” (Holliday, 2005; Murrell et al., 2005) depending on their state of differentiation after the DNA methylation and the chromatin modifications. Specific sets of genes are transcribed according to the status of “epigenome.” The “transcriptome” of individual cells is the steady-state levels of all the RNA species (after taking the modification and degradation into consideration). Expression profiling at the RNA level can capture the whole or a part of the transcriptome of a cell, tissue, or organ. These RNAs are translated into proteins. The “proteome” of individual cells is the steady-state levels of all the protein species (after taking the modification and degradation into consideration). “Phenome” (Mahner and Kary, 1997; Paigen and Eppig, 2000) is the whole set of phenotypes in a cell, tissue, or organ. Cells with the same proteome can have different phenomes, because they can have different cell state, e.g., different metabolites and signaling molecules. Expression profiling at RNA levels represents the status of epigenome more closely than expression profiling at protein levels. On the other hand, expression profiling at protein levels represents the phenome of a cell more closely than that at RNA level.
