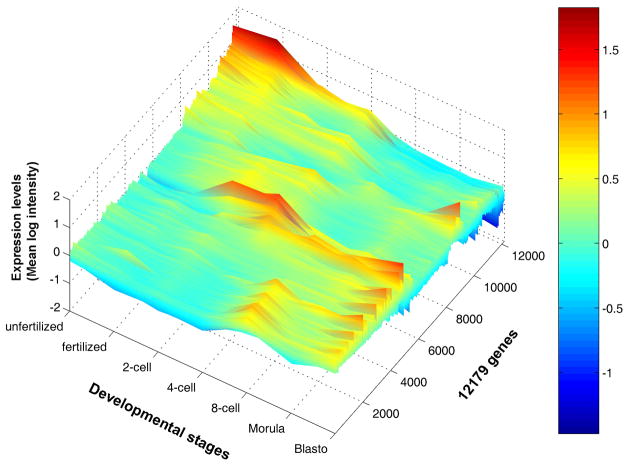
Figure 3. An example of bird’s-eye view of gene expression changes: mouse preimplantation development.
Signal intensities (log scale) (which represent relative RNA levels) of individual genes at each developmental stage are shown as color-coded lines. The expression levels of about 22,000 genes were monitored, but only genes that showed statistically significant changes are shown. Color codes are shown in a side bar: from a high expression level (red) to a low expression level (blue). Figure adapted from (Hamatani et al., 2004) and reproduced from (Ko, 2005).

