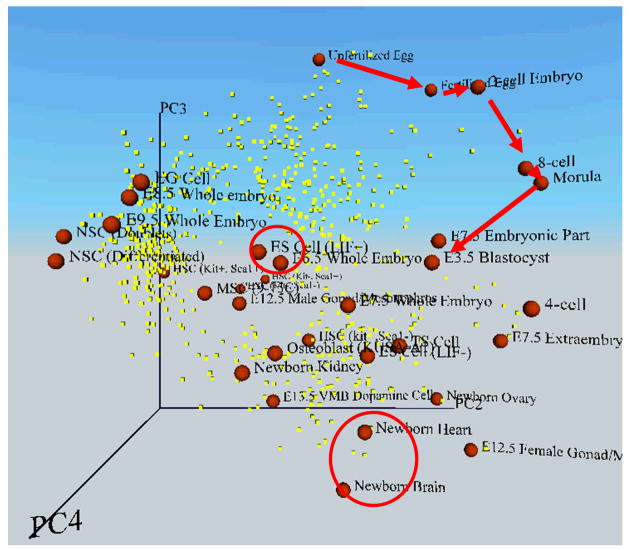
Figure 4. An example of multi-dimensional transcript profile space, which shows coordinates of cells according to their global gene expression patterns.
The global expression patterns (EST frequencies) of 2812 relatively abundant genes were analyzed by the Principal Component Analysis (PCA). Each cell or embryo (red sphere) was mapped to 3D space along with genes of significance (yellow dot) according to their values of each principal component (PC2, PC3, and PC4). Red arrows indicate the progress of embryos during preimplantation development: the stepwise transition from unfertilized egg to blastocyst. Red circles indicate ES cells and newborn organs (heart and brain). Here the distance between cells represents the degree of similarity in gene expression patterns. Cells or embryos that are mapped closely have more similar overall gene expression patterns than those mapped widely apart. Cells or embryos are labeled as follows (see also Fig. 5): 6.5 EP, E6.5 whole embryo (embryo plus placenta); 7.5 EP, E7.5 whole embryo (embryo plus placenta); 8.5 EP, E8.5 whole embryo (embryo plus placenta); 9.5 EP, E9.5 whole embryo (embryo plus placenta); 7.5 E, E7.5 embryonic part only; 7.5 P, E7.5 extraembryonic part only; NbOvary, newborn ovary; NbBrain, newborn brain; NbHeart, newborn heart; NbKidney, newborn kidney; 13.5 VMB, E13.5 ventral midbrain dopamine cells; 12.5 Gonad (F), E12.5 female gonad/mesonephros; 12.5 Gonad (M), E12.5 male gonad/mesonephros; HS (Kit−, Sca1−), hematopoietic stem/progenitor cells (Lin−, Kit−, Sca1−); HS (Kit−, Sca1+), hematopoietic stem/progenitor cells (Lin−, Kit−, Sca1+); HS (Kit+, Sca1−), hematopoietic stem/progenitor cells (Lin−, Kit+, Sca1−); HS (Kit+, Sca1+), hematopoietic stem/progenitor cells (Lin−, Kit+, Sca1+); and NS-D, differentiated NS cells. Figure adapted from (Sharov et al., 2003).

