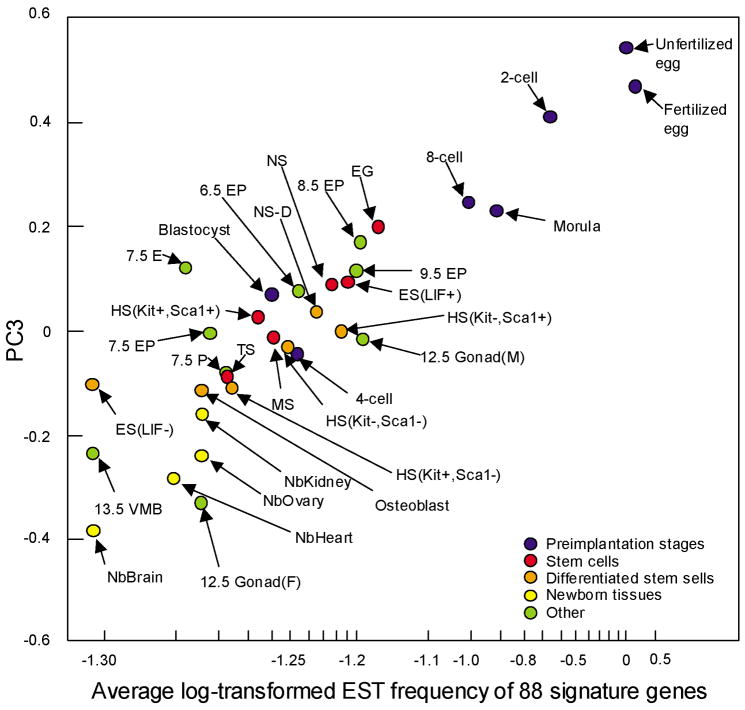
Figure 5. A possible molecular index for developmental potency.
Coordinates of each cell or embryo on PC3 axis from Fig. 4 are mapped against the average expression levels of 88 genes. These 88 genes include Birc2, Bmp15, Btg4, Cdc25a, Cyp11a, Dtx2, E2f1, Fmn2, Folr4, Gdf9, Krt2–16, Mitc1, Oas1d, Oas1e, Obox3, Prkab2, Rfpl4, Rgs2, Rnf35, Rnpc1, Slc21a11, Spin, Tcl1, Tclb1, and Tcl1b3. This figure shows that the average expression levels of 88 genes (parameters that can be measured experimentally) can be used as a surrogate for PC3 axis, which seems to capture the trend of losing developmental potency of cells. See Fig. 4 for the labels for cells or embryos. Figure reproduced from (Sharov et al., 2003).

