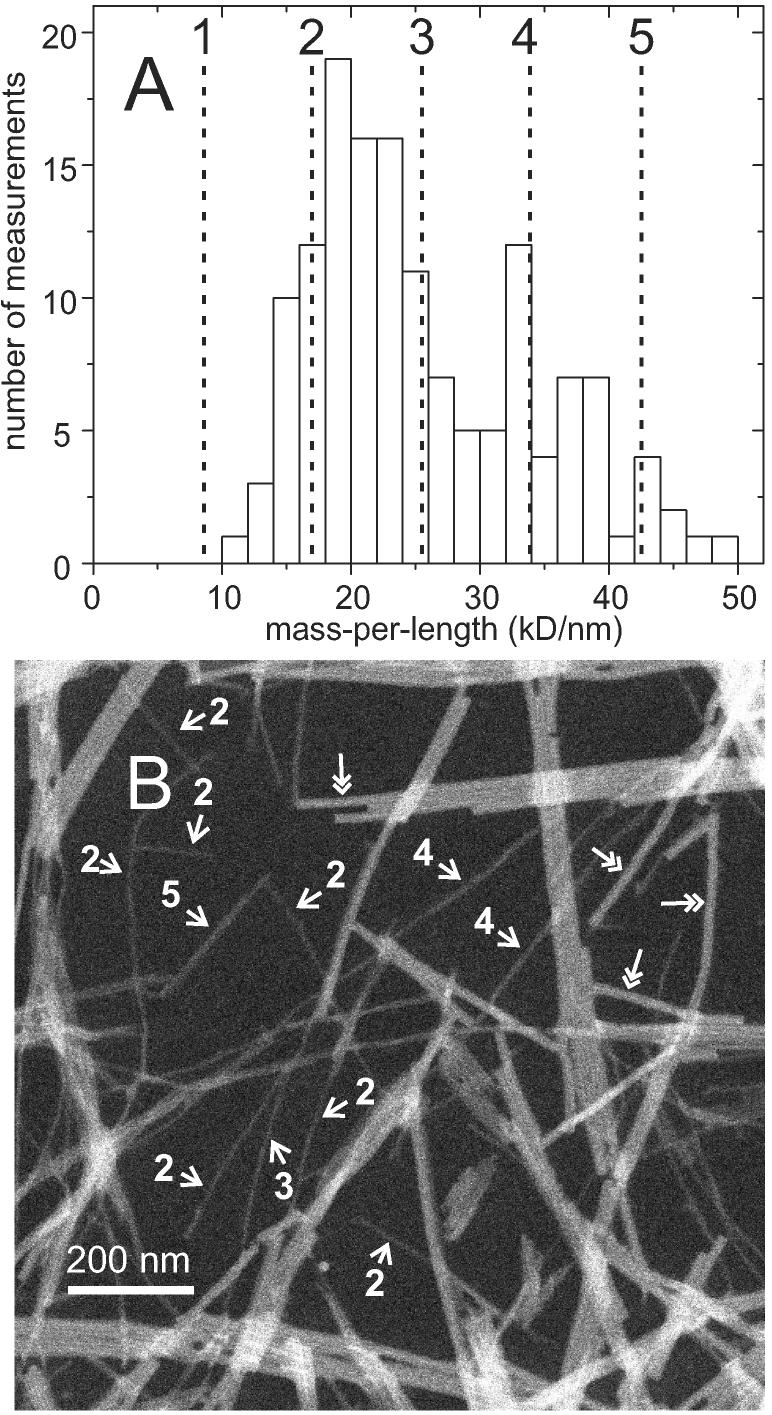
Figure 3.
(A) Histogram of MPL values extracted from STEM images of amylin fibrils. Vertical dashed lines indicate the ideal MPL values of integral numbers of molecular layers with cross-β structures. (B) Representative STEM image (50,000 X magnification). Approximate MPL values of individual fibrils are indicated in units of the MPL of one molecular layer. Double-headed arrows indicate tobacco mosaic virus particles used to determine the ratio of MPL to image intensity.

