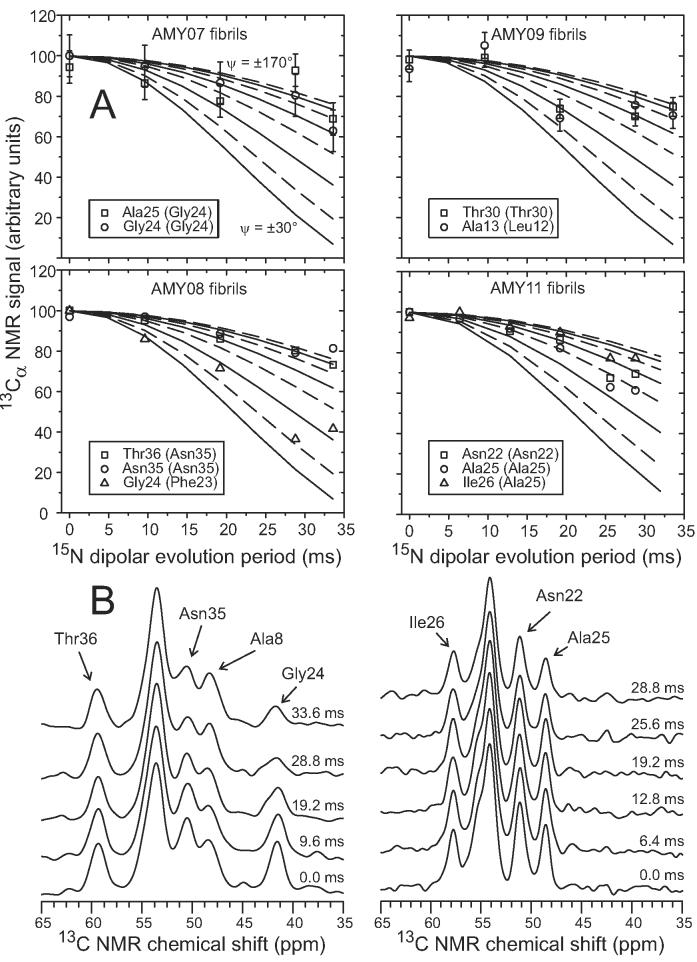
Figure 8.
(A) Experimental (symbols) and simulated (solid and dashed lines) 15N fpRFDR-CT data for amylin fibrils with AMY07, AMY08, AMY09, and AMY11 isotopic labeling patterns, detected through 13C NMR signals of Cα sites in the indicated residues. The experimental data serve as constraints on the backbone ψ torsion angles of residues in parentheses. Simulations are for ψ values ranging from ±30° (most rapidly decreasing solid line) to ±170° (least rapidly decreasing dashed line), in ±20° steps. Data for AMY07, AMY08, and AMY09 were obtained at 100.8 MHz 13C NMR frequency and 20.00 kHz MAS frequency. Data for AMY11 were obtained at 150.7 MHz 13C NMR frequency and 15.00 kHz MAS frequency. (B) 13C NMR spectra from which AMY08 (left) and AMY11 (right) data were obtained, with 15N dipolar evolution periods and assignments of 13Cα lines indicated.

