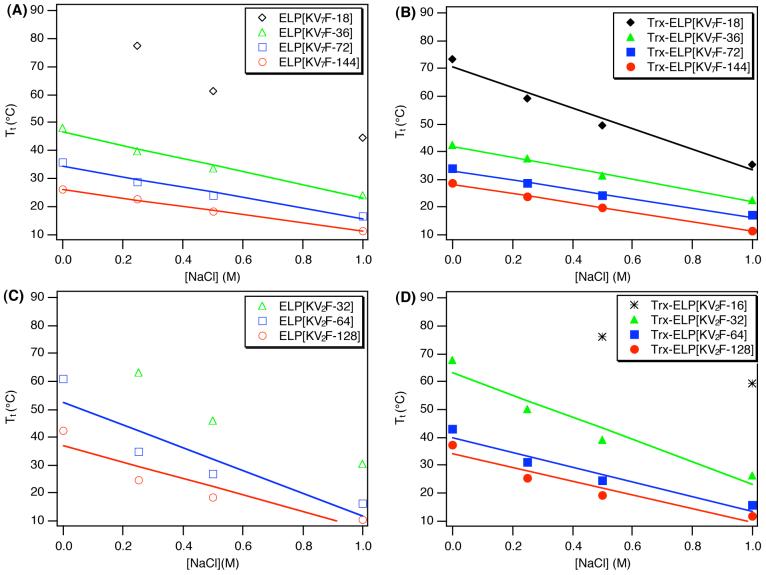
Figure 4.
Plot of transition temperature as a function of NaCl concentration and molecular weight for (A) ELP[KV7F], (B) Trx-ELP[KV7F], (C) ELP[KV2F], and (D) Trx-ELP[KV2F]. The transition temperature was measured from 25 μM ELP and Trx-ELP solutions in PBS with each added NaCl concentration. ELP[KV7F] (r2 from 0.980 to 0.998) and Trx-ELP[KV7F](r2 from 0.974 to 0.999) exhibit largely linear trends in Tt as a function of NaCl concentration, while ELP[KV2F] (r2 from 0.840 to 0.860) and Trx-ELP[KV2F] (r2 from 0.918-0.941) proteins show more non-linear character consistent with their higher ELP charge densities. Best fit linear correlations to salt sensitivity data were plotted only for ELPs and Trx-ELPs where the Tt could be accurately measured at all four tested NaCl concentrations in PBS (0, 0.25, 0.5, and 1 M NaCl). These correlations are summarized in Figure 5.

