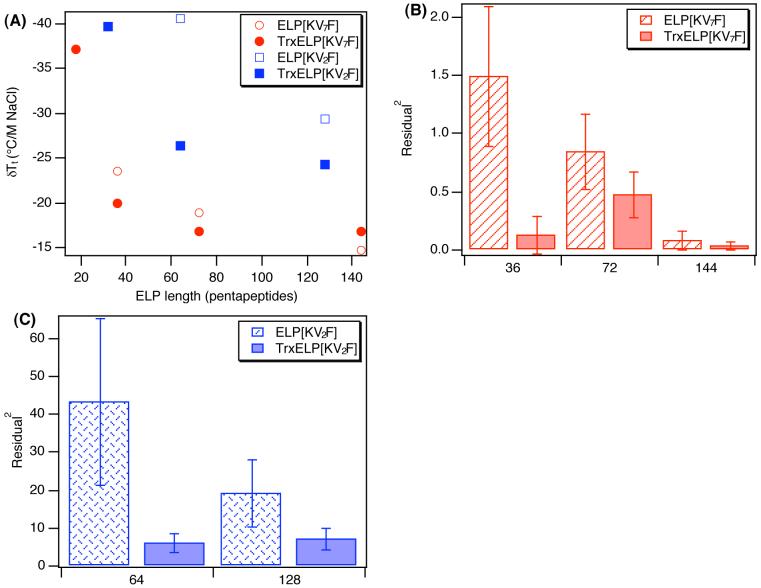
Figure 5.
Sensitivity of the ELP and Trx-ELP phase transition to added NaCl as a function of ELP length. (A) δTt/M of NaCl taken from the slope of a linear fit to the data in Figure 4 plotted as a function of number of ELP pentapeptides for ELPs and Trx-ELPs. Linear fit error is expressed as average of the squared fit residuals for (B) ELP[KV7F] and (C) ELP[KV2F] proteins and corresponding Trx fusions. ELP[KV2F] proteins were found to be significantly more non-linear than ELP[KV7F] proteins (p= 1.0×10⁻⁹) in their sensitivity to added salt, and error in the linear fit over all the ELP fusion proteins is significantly reduced (p=0.0033) upon fusion to Trx. Error bars reflect the standard deviation for n=4 salt concentrations per protein.

