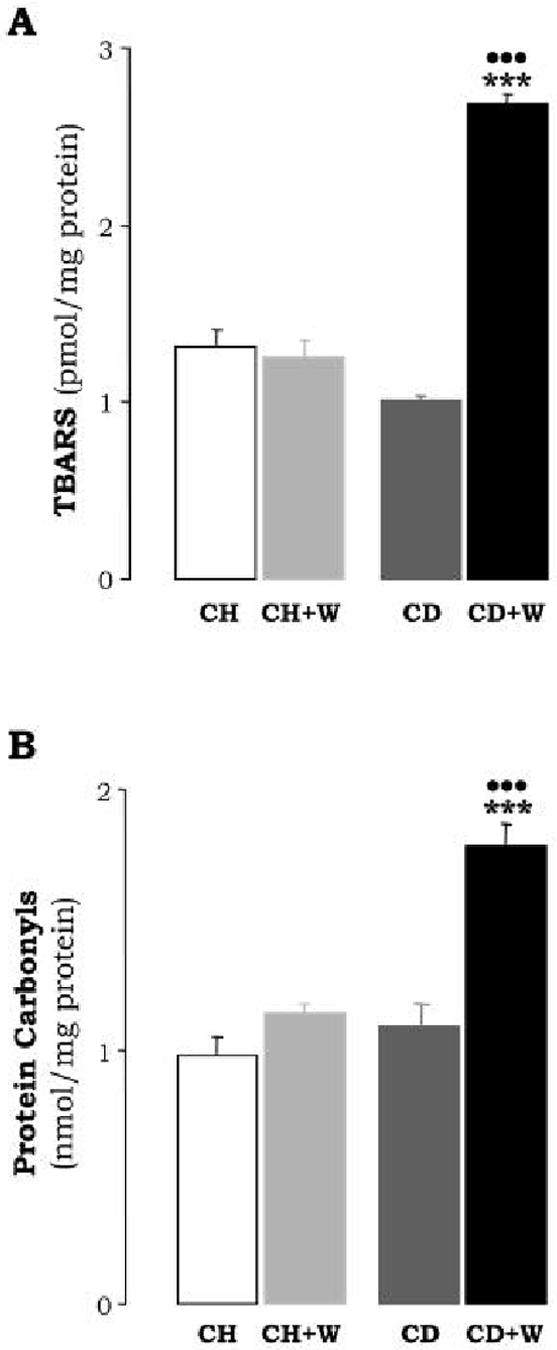
Figure 6.

Lipid Peroxidation (A). Lipid peroxidation by-products in the liver were estimated from the malondialdehyde levels (TBARS). Results are expressed as pmol per mg of protein and are means±S.E.M. (n=8). ***p<0.001 for CD+W vs. the CH+W; •••p<0.001 for CD+W vs. CD. Protein Carbonyls (B) are expressed as nmol per mg of protein and are means±S.E.M. (n=8). ***p<0.001 for CD+W vs. CH+W; •••p<0.001 for CD+W vs. CD. CH: chow diet, CD: choline-deficient diet, W: whiskey.
