
Fig. 3.
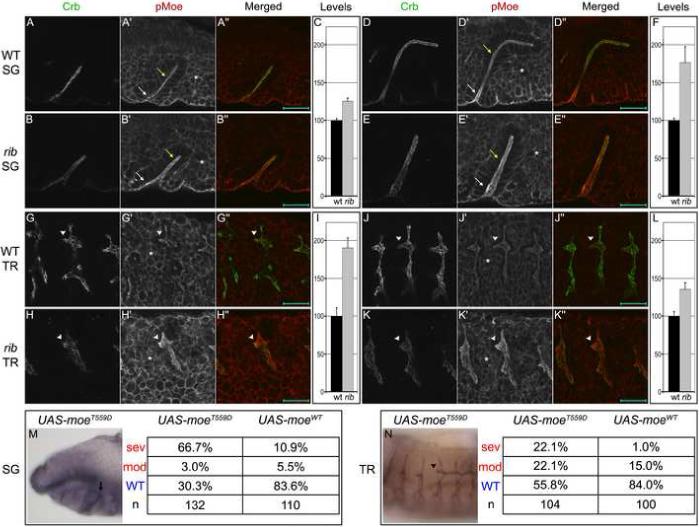
Rib is required for downregulation of apical Moe activity. (A-L) WT and rib SGs exhibited similarly high levels of apical pMoe (red) in invaginating cells (white arrows in A, B, D, E). After invagination, WT SG cells exhibited moderate, mesoderm-comparable (asterisk) levels (yellow arrows in A, D), whereas rib SG cells maintained the high invagination levels of pMoe (yellow arrows in B, E). WT TR exhibited moderate mesoderm-comparable levels of pMoe during primary branch formation and elongation (G, J), whereas rib TR exhibited relatively high levels of apical pMoe during these processes (H, K). Arrowhead in G, H, J, K indicates DT of metamere 4. Scale bars are 20 μm. Mesoderm-normalized apical pMoe pixel intensity indicated that rib SG and TR exhibit elevated levels of Moe activity (C, F, I, L). Images are single optical sections (to avoid photobleaching) acquired under identical conditions. Peak pMoe (apical)/ pMoe (mesoderm) ratios were averaged over three locations per organ in three embryos. Error bars show standard deviation of ratio. Crb is in green. (M-N) Tissue-specific expression of constitutively active MoeT559D results in rib-like phenotypes in the stage 12 SG (arrow in M) and stage 14 DT (arrowhead in N). Phenotypes are categorized as in Fig. 1. An antibody to Sas marks the SG lumen in black (M) and DT lumen in brown (N).