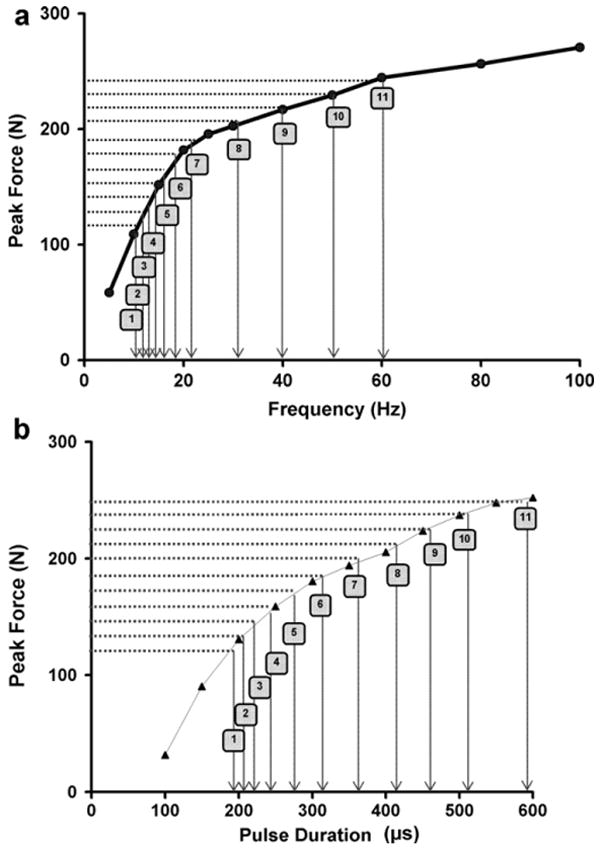
Fig. 2.

A schematic showing the peak force versus frequency (a) and peak force versus pulse duration (PD) (b) curves for a representative subject and the method used to determine steps for frequency-modulation (a) and PD-modulation (b). The horizontal shaded lines point to the 11 equal force-steps. The vertical arrows point to the corresponding frequency (a) and PD (b) steps used for modulation. Note that the frequency- and PD-steps were spaced on the curves such that each stepwise increase in frequency or PD caused an approximately equal increase in force output.
