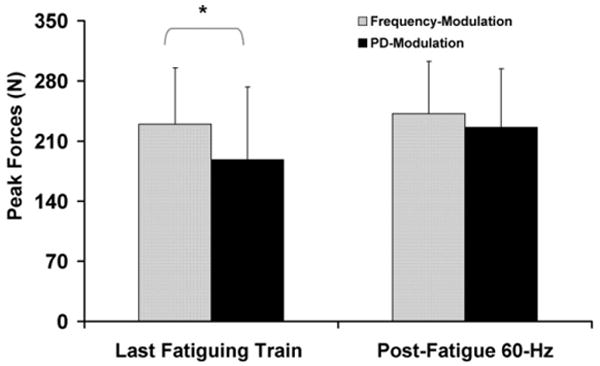
Fig. 7.

Average peak forces generated in response to the last fatiguing train (left) and the post-fatigue 60 Hz testing train (right) during the frequency-modulation and the pulse-duration (PD)-modulation protocol. Both the last fatiguing train and the post-fatigue testing trains were 60 Hz trains with 600 μs PD and were separated by a 1 s rest time and a twitch. Note the larger increase in peak force from the last fatiguing train to the post-fatigue 60 Hz testing train during the PD-Modulation than the frequency-modulation protocol. *p ≤ 0.05.
