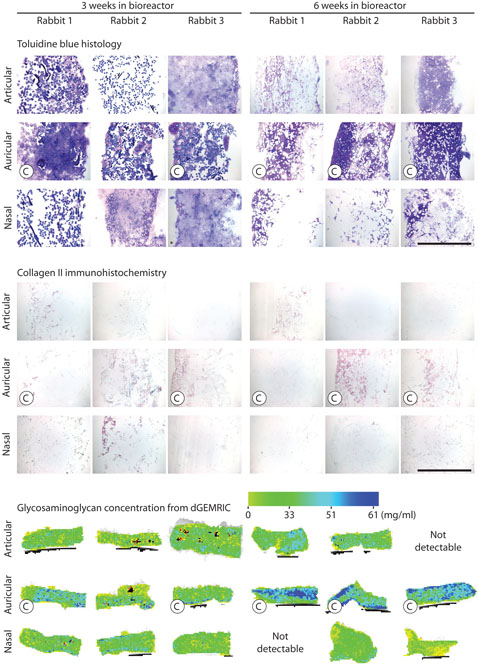
FIG. 4.
Structure and composition of tissue-engineered cartilage samples as analyzed by histology, immunohistochemistry, and dGEMRIC. Top: Images of sections stained by toluidine blue. Bar = 1 mm. Middle: Images of sections immunostained for collagen II. Bar = 1 mm. Bottom: Pseudo color representation of GAG concentration (mg GAG per mL tissue water) as quantified by dGEMRIC. Each dGEMRIC slice transects an entire sample. “C” indicates a sample that completed biomechanical testing.

