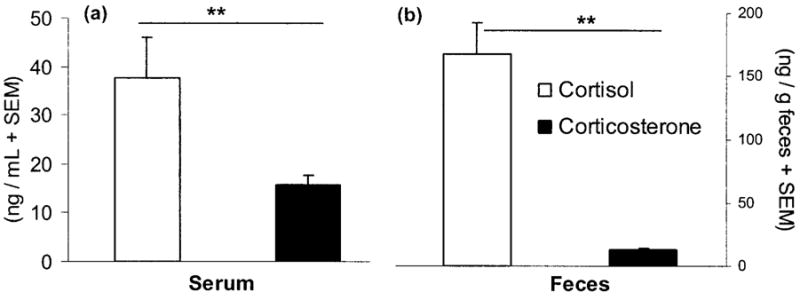
Figure 4.

Mean (+SEM) serum (a) and fecal (b) corticoid concentrations in captive Spermophilus beldingi, measured with cortisol (open bars) and corticosterone (filled bars) antibodies. Lines over bars represent significant differences. Double asterisks indicate P < 0.01.
