
Figure 8.
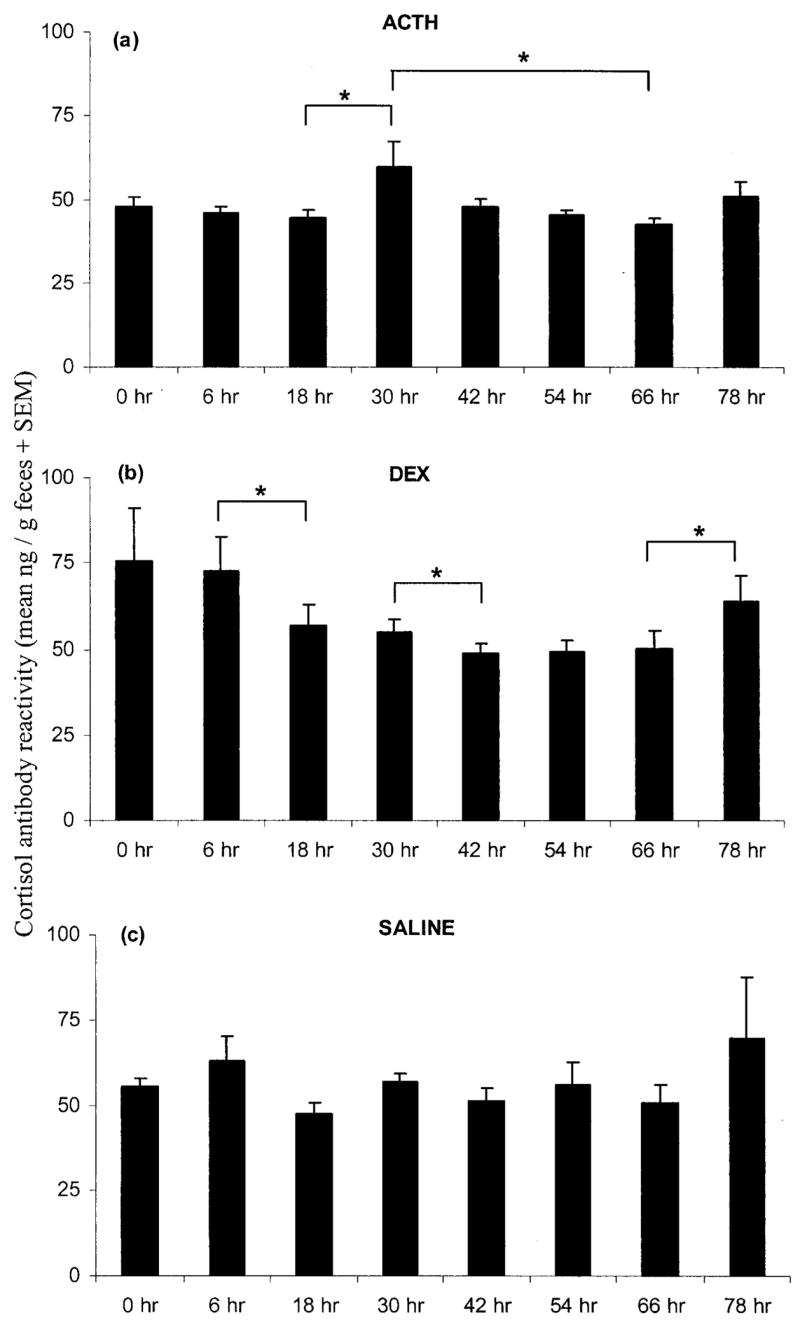
Mean (+SEM) fecal corticoid concentrations measured with cortisol antibody in captive Spermophilus beldingi treated with ACTH (a), DEX (b), or saline (c). Hour 0 is the time of injection, with sampling continuing every 6 or 12 h. Brackets over columns indicate significant differences between the two end columns. Asterisks indicate P < 0.05.