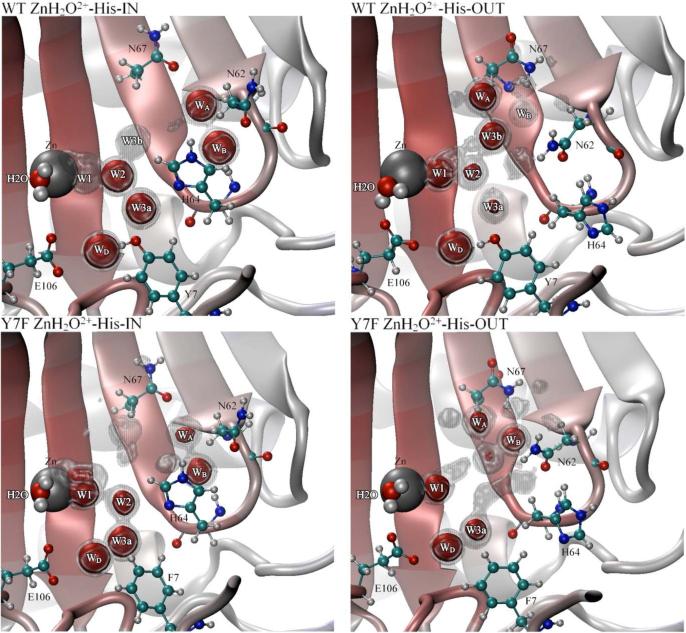
Figure 4.
Occupancy data for water oxygens inside the active site of HCA II. Gray regions represent 50% occupancy and the red regions represent 75% occupancy for the WT ZnH2O2+−His-IN system, WT ZnH2O2+-His-OUT system (Top left and right panel, respectively), Y7F ZnH2O2+-His-IN system and the Y7F-ZnH2O2+-His-OUT system (Bottom left and right panel, respectively).

