
Figure 6.
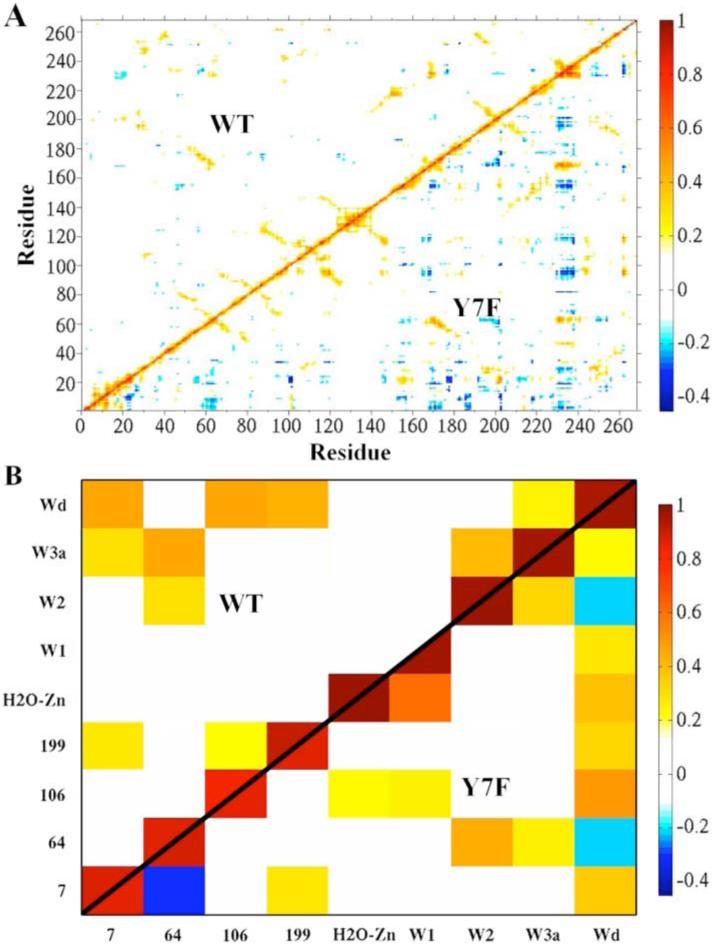
Correlation plots. (A) Residue-residue correlation plot of WT (upper diagonal) and the Y7F mutant (lower diagonal) of the HCA II enzyme. (B) The active site water-water and active site water-residue correlation plot of WT (upper diagonal) and the Y7F (lower diagonal).