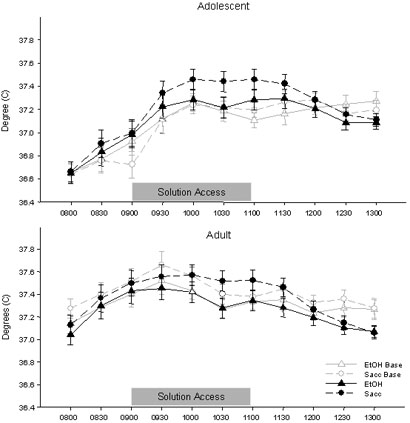
Figure 3.
BT data from adolescent (top) and adult (bottom) rats with access to both solutions in Exp. 1 (represented as mean ± SEM degrees C). The gray lines represent BT on the baseline day in the individual solution access groups while the black lines represent the mean of all seven solution access days. The solution access period spanned the bins from 0900 to 1100, with pre-access weighing occurring at 0830.

