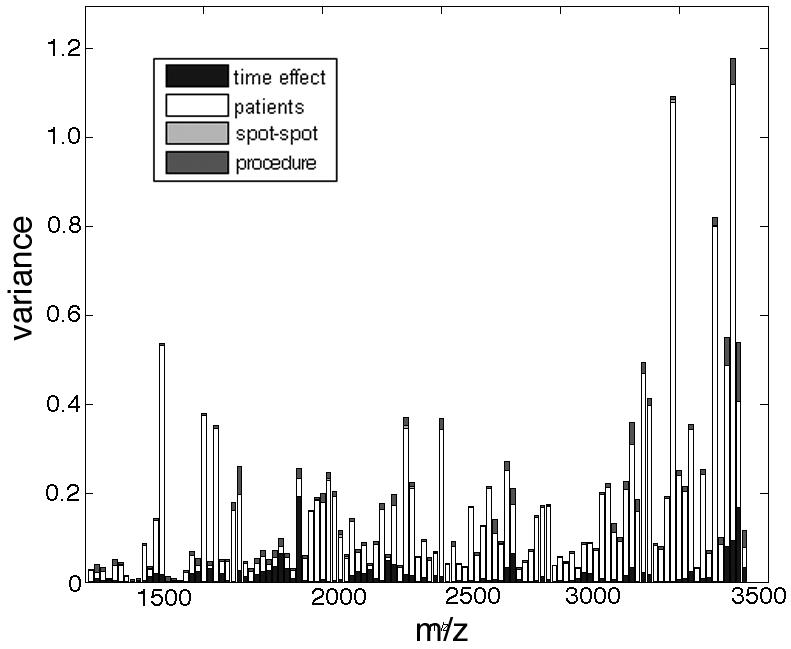
Figure 1.

Analyses of the reproducibility from MALDI-TOF profiles have the urine proteome and supervised classification of PCa, HGPIN and control subjects. Urine from 3 normal subjects was processed 16 times each as described in the text. Each sample was spotted 3 times each and the spectra from the spotted samples analyzed by MALDI-TOF were assigned bins. The individual signals from each profile were compared and the variance for signals in a particular bin based on indicated parameters was plotted.
