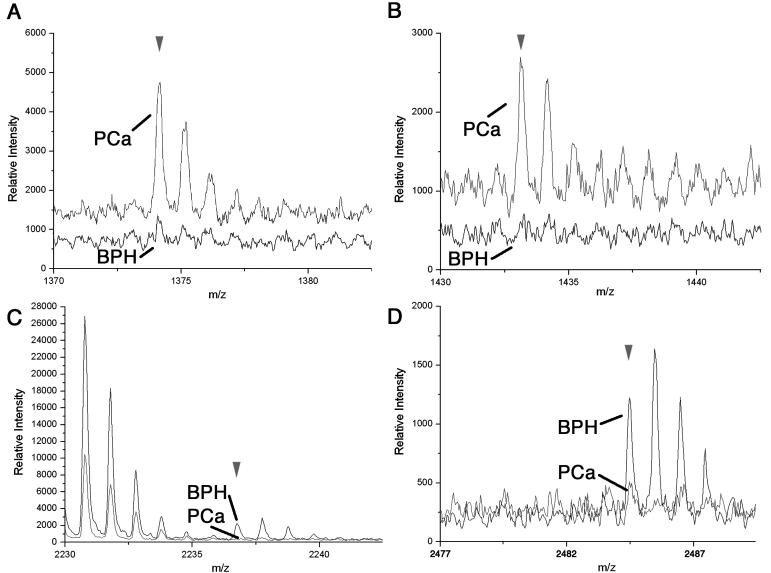
Figure 3.
Distinguishing MALDI-TOF signals that differentiate between PCa and BPH patients. Data collected in the reflectron mode enables isotopic resolution of the following m/z values (A) 1373.1, (B) 1433.5, (C) 2236.3, and (D) 2484.6. The BPH (black) and PCa (gray) mean spectra in each panel were overlaid. The arrowhead indicates the monoisotopic peak. In each panel the offset of the overlaid spectra is set at 0%, however the differing level of baseline noise in the particular regions of the spectra cause the offset to appear greater in some cases.

